Build a project management dashboard with Bryntum Gantt, AG Grid, AG Charts, and Claude Code

Claude Code with Opus 4.6 is one of the best agentic coding tools available right now. Its new Chrome integration makes it even better by letting Claude test and debug web apps directly in the browser. It can visually inspect the UI, interact with it like a user, and read console errors for debugging. This helps Claude Code fix issues on its own and iterate until it gets the desired result.
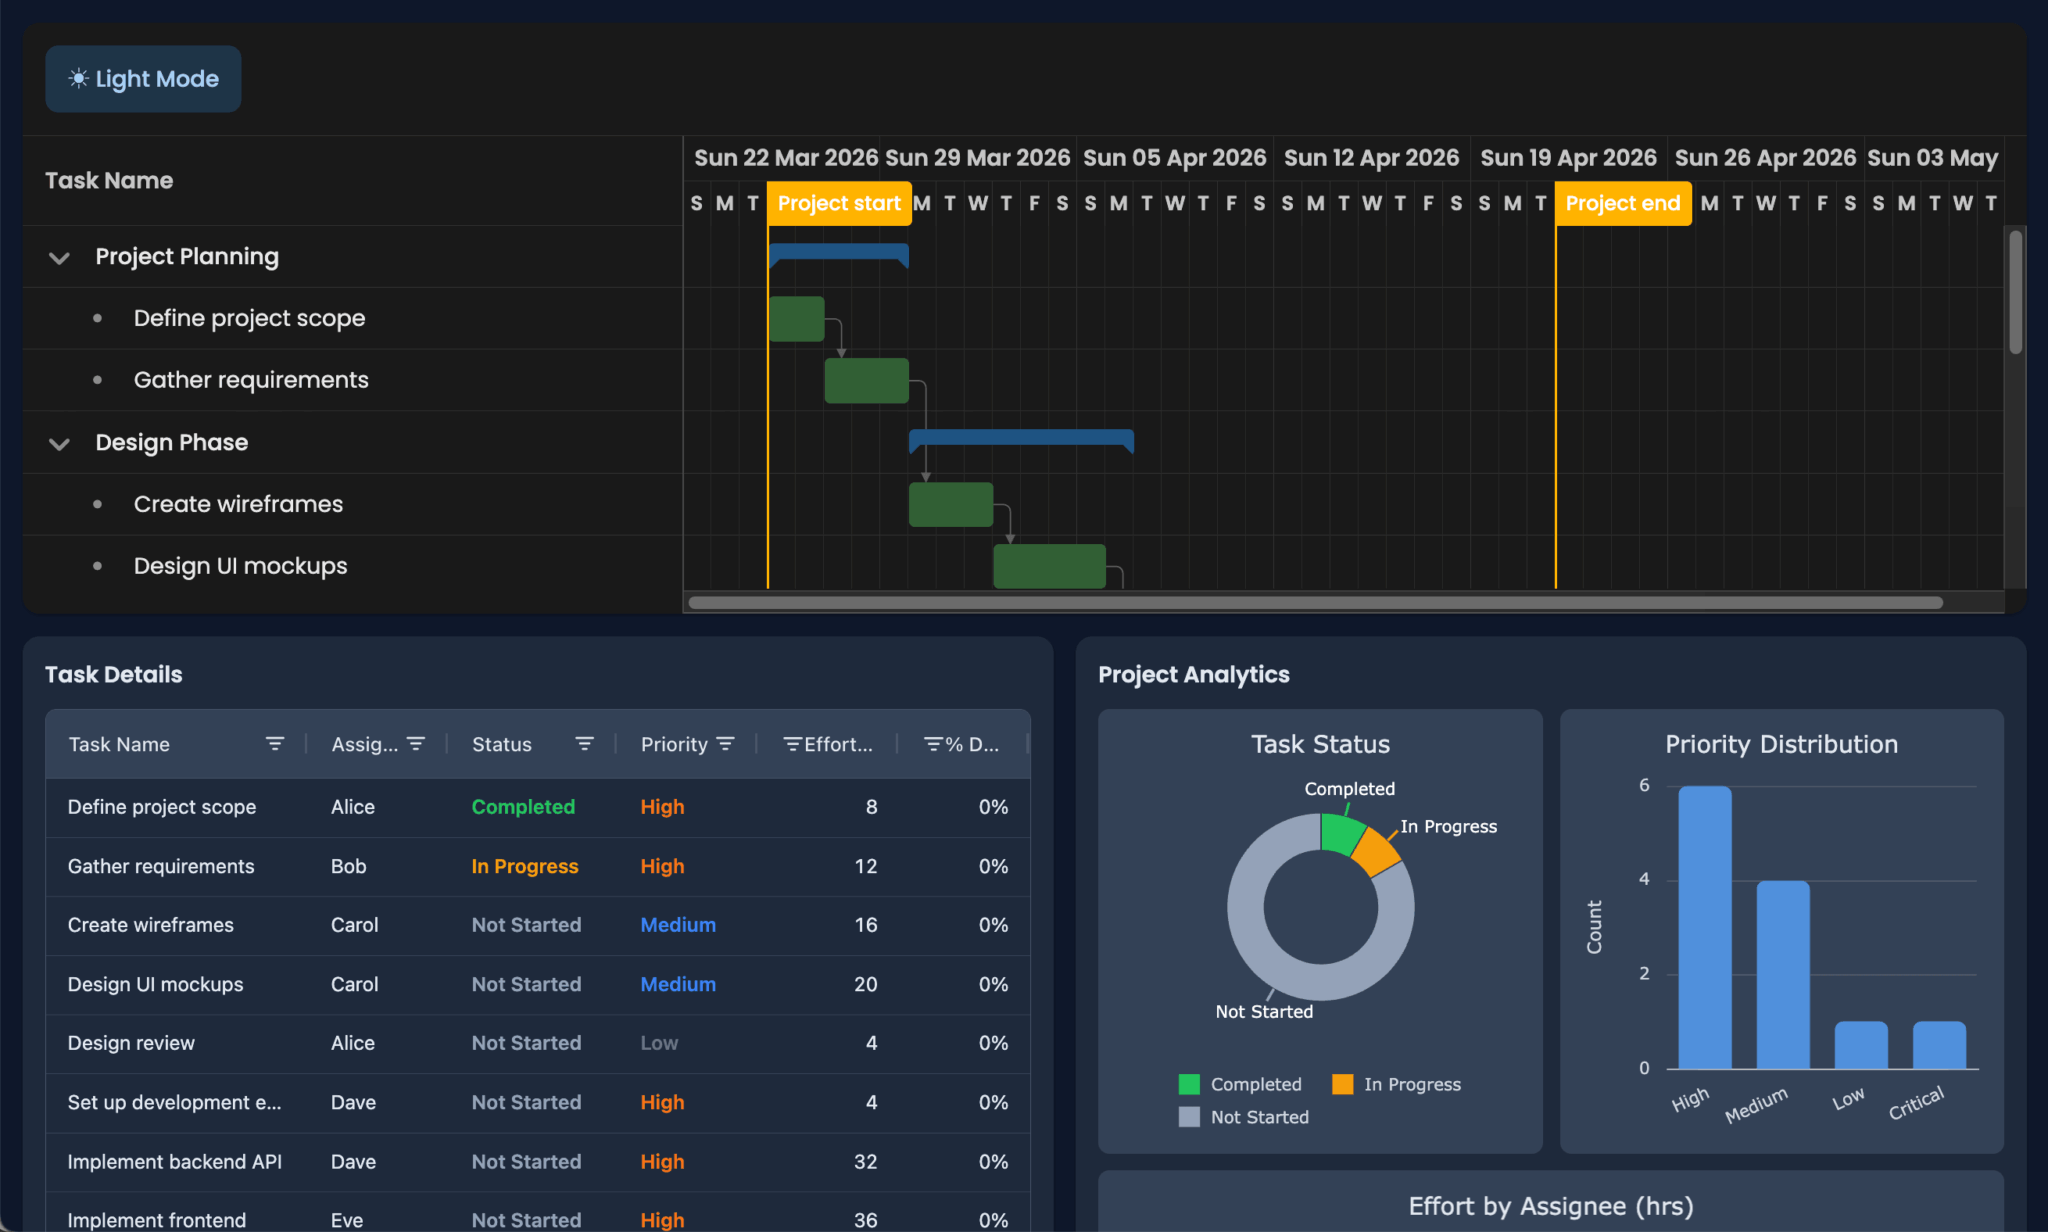
We put the Claude in Chrome extension to the test by building a project management dashboard with Bryntum Gantt, AG Grid, and AG Charts:
We used prompts, Bryntum’s MCP server, AG Grid’s MCP server, and Bryntum’s bryntum agent skill. These enterprise-grade components handle scheduling, data grids, and charting. With Claude Code, you can stack them together like LEGO bricks to build complex web apps.
Prerequisites
Below are the Claude Code prompts we used and the results we got. To follow along and try the prompts yourself, you need a paid Claude plan to access Claude Code.
To get the most out of Claude Code, install the Bryntum and AG Grid MCP servers, so Claude Code can access version-specific documentation.
Install the Bryntum MCP server with the following command:
claude mcp add --transport http bryntum https://mcp.bryntum.comInstall the AG Grid MCP server:
claude mcp add ag-mcp npx ag-mcpThen, you can find the bryntum agent skill in the Bryntum skills GitHub repository. The bryntum skill guides Claude through integrating Bryntum components into web apps. It complements the documentation provided by the Bryntum MCP server with practical guidance on common mistakes Claude makes with Bryntum components. Ask Claude Code to add the skill locally or to your project.
To use Claude Code with Chrome, you need the following:
- A Google Chrome or Microsoft Edge browser
- The Claude with Chrome extension (version 1.0.36 or higher), available in the Chrome Web Store for both browsers
- Claude Code (version 2.0.73 or higher)
To use the Chrome extension, start Claude Code with the --chrome flag:
claude --chromeYou can also run /chrome and select Enabled by default to enable the extension by default.
If you use VS Code, check out the Claude with Chrome VS Code extension.
You also need Node.js version 20.19+ for Vite, which Bryntum’s quick start guides use.
Creating a Bryntum Gantt app from scratch with Claude Code
We started with a simple prompt:
Create a React Bryntum Gantt. Use Claude Code with Chrome to run the app and verify that it works.Claude Code created a working Bryntum Gantt using the React Gantt quick start guide it found using the Bryntum MCP server:
It scaffolded a React and TypeScript Vite app with three key files:
App.tsxfor the Gantt componentGanttConfig.tsfor the Gantt configurationdata.jsonfor the task data
The task data models a documentation project with nested tasks and dependencies. Claude in Chrome then verified that the Gantt was created successfully.
We were living dangerously by running Claude Code in “YOLO mode”, claude --dangerously-skip-permissions, so it could create the Gantt on its own. It’s best not to use YOLO mode unless you’re working in a sandbox.
The trial packages used here can be installed without a license. If you have a Bryntum license, let Claude Code know so it can install the licensed version. Bryntum also supports Vue, Angular, and vanilla JavaScript.
Styling the Gantt with Claude Code
The Gantt had more columns than we needed, and we wanted a dark mode toggle.
We prompted Claude Code to remove the extra columns and add a dark mode button:
Only show name column and add a dark mode toggle button in a toolbar at the topOnce again, Claude Code used the Bryntum MCP server and Claude in Chrome to make the changes:
It trimmed the columns down to just the task name and used DomHelper.setTheme() to toggle between the light and dark Bryntum Gantt themes. It added the toggle button using Bryntum’s toolbar config and button widget:
tbar : [
    '->',
    {
        type        : 'button',
        text        : 'Dark Mode',
        icon        : 'b-fa-moon',
        toggleable  : true,
        onToggle({ pressed }: { pressed: boolean }) {
            DomHelper.setTheme(pressed ? 'svalbard-dark' : 'svalbard-light');
            this.text = pressed ? 'Light Mode' : 'Dark Mode';
            this.icon = pressed ? 'b-fa-sun' : 'b-fa-moon';
        }
    }
],
The tbar config accepts any Bryntum widget. See the widget Kitchen Sink demo for a complete list of available widgets.
Using Chrome, Claude Code tested the dark mode button by clicking on it and taking screenshots.
Building out a project management dashboard by adding AG Grid and AG Charts
For the next step, we asked Claude Code to extend the Gantt into a full project management dashboard with an AG Grid table and AG Charts:
Extend this Bryntum Gantt into a project management dashboard. Add AG Grid (community edition) as a task table and AG Charts (community edition) with charts that visualize project status and progress. Enrich the task data with assignee, status, priority, and effort fields. Extend the dark mode toggle to apply to all components. Use Claude in Chrome to verify everything works.Claude Code used the AG Grid MCP server and created a to-do list of tasks to work through:
It installed the free community editions of AG Grid and AG Charts, then added the following fields to the task data:
- Assignee
- Status
- Priority
- Effort
Shared data and dark mode contexts keep all components in sync. The app displays the filterable and sortable AG Grid task table next to the AG Charts visualizations, which include a task-status pie chart and priority- and effort-by-assignee bar charts. Everything is arranged in a dashboard layout alongside the existing Bryntum Gantt.
Initially, Claude Code encountered an issue that prevented anything from rendering. Using Chrome, it read the console errors, including:
Uncaught Error: AG Charts - Unknown chart type; Check options are correctly structured and series types are specifiedClaude Code identified the misconfigured chart options and fixed the issue on its own. The dark mode toggle then worked across the entire dashboard. Clicking the toggle switched the theme for the Gantt, table, and charts together.
However, when we changed data in the Gantt, it didn’t update the table or charts. The grid was also read-only, so we prompted Claude Code again:
If I change data in Gantt, the Charts and table do not update. I also want the table to be editable and for changes in one place to update everywhereClaude Code fixed the data flow so edits in the Gantt or the table synced across all components:
One-shotting the dashboard
For the finale, we combined all the prompts, with a few tweaks, into a single prompt:
Create a React Bryntum Gantt project management dashboard:

1. Create a Bryntum Gantt showing only the name column. Task data includes assignee, status, priority, and effort.
2. Add a toolbar to the top of the Bryntum Gantt and add a dark mode toggle button to it. Text must be readable in both modes.
3. Add AG Grid (community) as an editable task table. Bryntum Gantt data is the single source of truth — edits in either sync everywhere.
4. Add AG Charts (community) for visualizing project status and progress.
5. Make sure that the dashboard layout has good spacing and that components are sized well.
6. Dark mode applies to all components.

Verify each step using Claude Code with Chrome.
Thirteen minutes and 24 seconds later, we had the project management dashboard:
Claude Code used the bryntum skill, Bryntum MCP server, and AG Grid MCP server to build the dashboard. It converted the numbered steps into a to-do list and worked through each one. It tested each step using Claude in Chrome by clicking the dark mode button and editing cells in both the AG Grid table and Bryntum Gantt to verify that data synced between components.
Conclusion
We went from zero to a styled Gantt chart, then to a full project management dashboard, and finally rebuilt the entire dashboard with a single prompt. Claude Code handled the configuration, integration, layout, testing, and debugging. Bryntum, AG Grid, and AG Charts provided the complex UI building blocks.
The Claude in Chrome feature lets Claude Code evaluate its output and see error messages in the browser, where your users are. That lets it debug and fix issues without your help.
Next steps
Both Bryntum and AG Grid have AI features that you can add to let users interact with components using natural language:
- The Bryntum AI feature
- The AG Grid AI Toolkit
You can also add drag-and-drop capabilities between the Bryntum Gantt and AG Grid. See our blog post on How to integrate a React AG Grid with a React Bryntum Scheduler Pro.
To add a backend, take a look at our Bryntum Gantt backend guides and blog posts:
Did you follow along and get similar results, or did you run into issues? If you have feedback, send us a message on the Bryntum Support Forum.