Best JavaScript Gantt Chart Libraries in 2026: Comparison Guide
We strive to keep posts updated, but code samples may sometimes be outdated. Humans, see the Bryntum documentation; agents, https://mcp.bryntum.com for the latest info.
Looking for a Gantt chart library to use in your project management app?
You’ll want to consider how easy a library is to get started with, what features it offers, and what it costs.
We compare five common libraries for creating Gantt charts and give you a list of pros and cons for each: Bryntum Gantt, DHTMLX Gantt, Syncfusion Gantt, JSCharting Gantt, and Frappe Gantt.
For quick takeaways for developers, jump to the feature Comparison table and Frequently Asked Questions section at the end.
Table of Contents
- What is a Gantt chart?
- Why use a Gantt chart in your app?
- Bryntum Gantt
- DHTMLX Gantt
- Syncfusion
- JSCharting
- Frappe
- Comparison table
- Frequently Asked Questions
What is a Gantt chart?
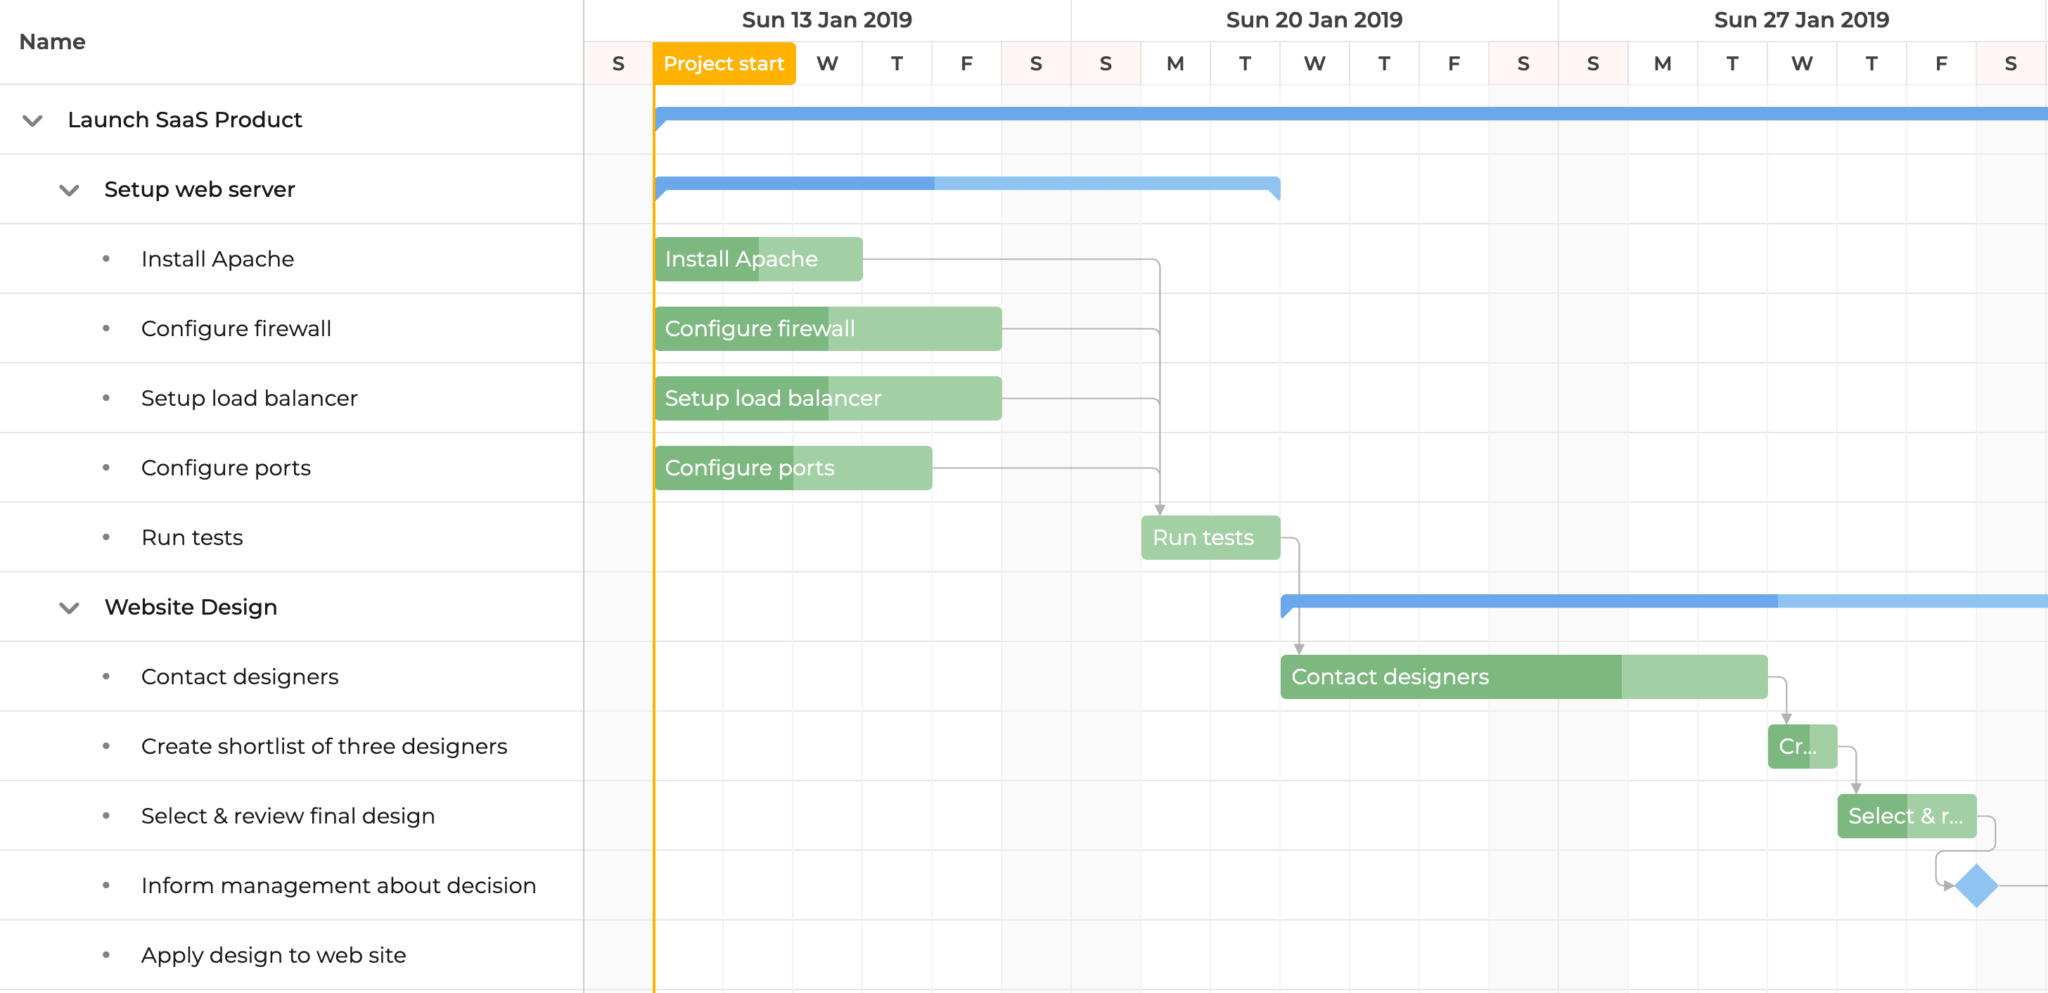
A Gantt chart is a type of bar chart that visualizes a project schedule. Tasks are listed on the vertical axis, time runs along the horizontal axis, and each task is drawn as a horizontal bar showing its start date, duration, and end date. Most Gantt charts also show dependencies between tasks as lines connecting the bars, along with milestones, task progress, and parent tasks that group related work.
Why use a Gantt chart in your app?
A Gantt chart gives users an at-a-glance view of an entire project: what needs to happen, in what order, and whether work is on track. Interactive Gantt charts go further, letting users reschedule tasks by dragging bars, create dependencies, assign resources, add contstraints, and immediately see the knock-on effects of a change.
Gantt charts are used in project management and scheduling apps across many industries, for example:
- Software teams planning releases and sprints.
- Construction and engineering firms scheduling project phases, contractors, and equipment.
- Manufacturers planning production runs and machine time.
- Agencies and event planners coordinating deadlines across teams.
If your app needs this kind of functionality, a JavaScript Gantt chart library saves you from building complex scheduling and rendering logic from scratch. The five libraries below are among the most popular options.
Bryntum Gantt
The Bryntum suite of commercial JavaScript web components for project management and resource scheduling includes Bryntum Gantt, which is easy to use with popular frontend frameworks like React, Vue, and Angular. Bryntum has a good selection of demos that show you how to use their products as web components and help you integrate Bryntum components with PHP or ASP.NET backends, Ionic for mobile app development, and Salesforce.
Getting started
You have two options to install the Bryntum Gantt library:
You can try out Bryntum components for free using our public Bryntum trial packages.
If you have a Bryntum license, please refer to our npm Repository Guide to access the private Bryntum repository.
To make a Bryntum Gantt chart, you create an instance of the Gantt chart object and pass in a configuration object to the constructor function. The configuration determines what the Gantt chart looks like and where it gets data from:
import { Gantt } from "@bryntum/gantt";

const gantt = new Gantt({
  appendTo: document.body,
  viewPreset: "weekAndDayLetter",
  timeAxis: {
    weekStartDay: 1,
  },
  columns: [{ type: "name", width: 250, text: "Tasks" }],
});
The appendTo property is the DOM element that the Gantt chart will be added to as a child. The viewPreset determines the layout of the timeline view and headers. The timeAxis property allows you to modify the timeline headers. The columns property is used to define the data column on the left side of the Gantt.
To style the Gantt, you can use one of these themes, each with light and dark variants:
- Svalbard (the default)
- Visby
- Material3
- Stockholm
- Fluent2
- High Contrast
You’ll need to import the structural CSS, the theme, and Font Awesome for the Bryntum Gantt to render correctly:
/* FontAwesome is used for icons */
@import "@bryntum/gantt/fontawesome/css/fontawesome.css";
@import "@bryntum/gantt/fontawesome/css/solid.css";
/* Structural CSS */
@import "@bryntum/gantt/gantt.css";
/* Bryntum theme of your choice */
@import "@bryntum/gantt/svalbard-light.css";
You can modify the themes or create your own custom theme.
Basic Bryntum Gantt data consists of tasks and dependencies. You use the Bryntum Crud Manager to get and sync data changes with a backend. The Crud Manager uses AJAX for fetching and posting data and JSON for encoding data. You can configure the Crud Manager in the project property of the Gantt configuration object. For example, in the code below, the transport property is used to populate the Gantt chart data stores:
project: {
  transport: {
    load: {
      url: "data/data.json",
    },
  },
  autoLoad: true,
},
You can configure transport to sync data changes to a specific URL. For more information, read the project data guide in the Bryntum docs.
You don’t have to use the Bryntum Crud Manager for data fetching in your Bryntum Gantt. Other methods are available, such as binding existing data to a component.
Features
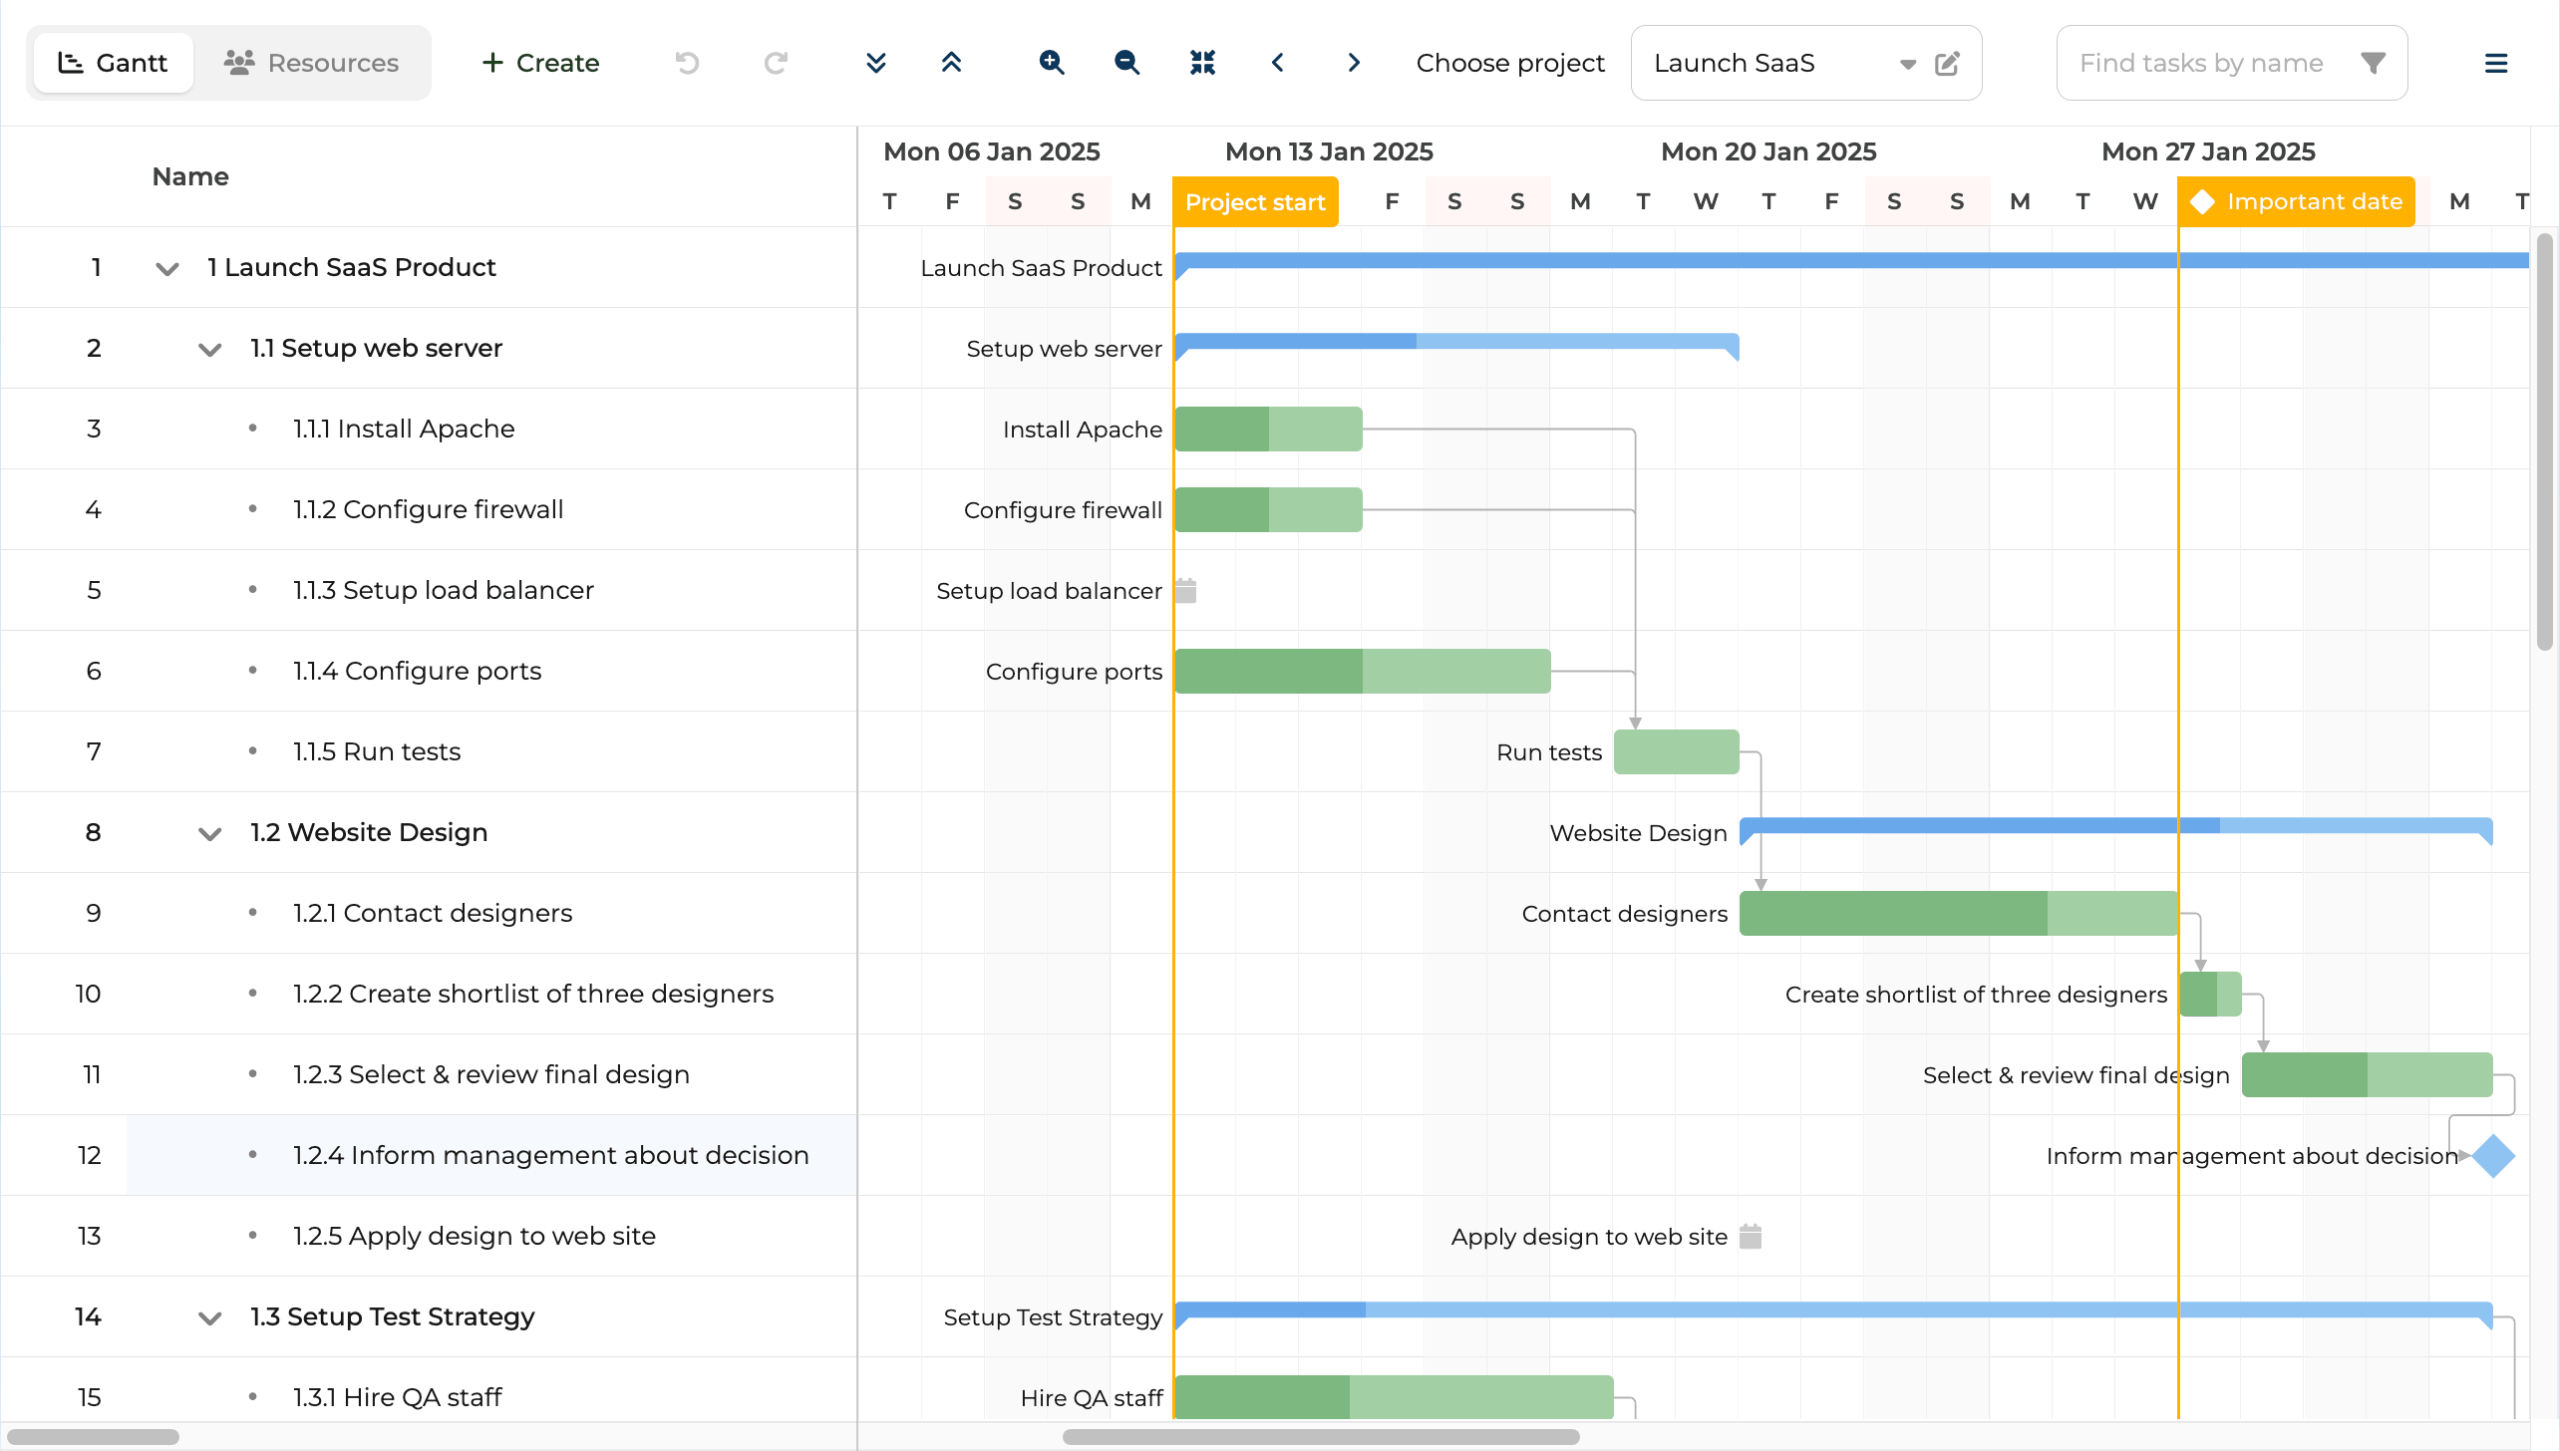
Bryntum Gantt has a lot of functionality out of the box, such as adding, editing, and deleting tasks and dependencies. The component is highly customizable and has extensive documentation that includes live code demos. Advanced features of Bryntum Gantt include:
- Critical path calculation.
- Undo and redo functionality.
- Auto-scheduling, constraints, and backward scheduling.
- Export and import from Microsoft Project.
- Easy integration with other Bryntum project management tools, like Bryntum Task Board.
- Large dataset handling and performance tuning.
- A Bryntum AI assistant chat panel that lets users interact with the Gantt using natural language.
- An MCP server and AI skills that give AI coding assistants like Claude Code and Cursor accurate, version-specific knowledge of the Bryntum APIs and framework integration patterns.
Take a look at a summary of the Bryntum Gantt features here and view demos of the features here.
Bryntum has an active blog where you can read tutorials like Using Better Auth with the Bryntum React Gantt and customer experiences of using Bryntum components.
The Bryntum Gantt chart is built with JavaScript ES6+, has no external dependencies, and uses a super-fast rendering engine, making it a performant option for your Gantt chart, even when working with large datasets.
Pricing
You can purchase Bryntum components individually or as a discounted bundle. The Bryntum Gantt license starts at $940 per developer for a Small Team license (minimum three developers), dropping to $900 per developer on a Large Team license (minimum ten developers). The licences are perpetual with 1 year of free upgrades and support. There is a separate OEM licence. Discounts are offered for charity, environmental, and educational work, as well as for start-ups.
Pros
- The Bryntum suite of components have detailed documentation with live code examples and blog post tutorials.
- A range of demos for Bryntum Gantt and other Bryntum components include source code and tips for integrating with various frameworks. You can search the Bryntum demos page by frontend framework or features, or using a text search.
- Bryntum Gantt is highly customizable with a wide range of advanced features.
- Bryntum Gantt is a high-performance library well suited to large datasets.
- Bryntum has a support forum and offers additional professional services.
- Bryntum supports AI-assisted development with an MCP server and AI skills, and includes an AI assistant chat panel for end users.
- The luxurious Bryntum Gantt UX is a step above its competitors’: The Bryntum UI is clean and focused on critical project information so that you don’t lose essential tasks in customization options or large datasets.
Bryntum Gantt is built with both the developer and end user in mind, with a sleek, modern design that makes it a breeze to visually assign tasks and navigate intricate projects. Features like drag-and-drop resource allocation and instantaneous project management recalculations as well as the AI chat panel add value to the component that’s hard to beat.
Cons
Bryntum Gantt may be an expensive option if you only need a simple Gantt chart.
DHTMLX Gantt
DHTMLX has a number of commercial web components for project management, data analysis, and content management. You can use the DHTMLX Gantt library with popular frontend frameworks React, Vue, and Angular, and the DHTMLX website hosts demos, documentation, and tutorials for various server-side integrations such as with Salesforce, PHP, Node, ASP.NET, and Ruby on Rails.
Getting started
You have three options to install the DHTMLX Gantt library:
- Download the package and use the source files.
- Use CDN links.
- Use npm.
To create a basic Gantt chart with DHTMLX Gantt, initialize the Gantt in an HTML container using the init() method. You can configure the look of the Gantt chart using the gantt.config and gantt.templates properties. In the code example below, we define two columns for a Gantt chart:
import { gantt } from "dhtmlx-gantt";

const body = document.querySelector("body");

gantt.config.columns = [
  { name: "text", label: "TASKS", width: 250, tree: true },
  { name: "add", label: "", width: 44 },
];

gantt.init(body);
The "add" column adds a column with a “+” sign, which you use to create a new task. The gantt.config and gantt.templates definition code should be above the Gantt initialization.
Style the Gantt using one of the eight DHTMLX Gantt skins (Terrace, Dark, Material, Contrast Black, Contrast White, Skyblue, Meadow, and Broadway). All CSS is imported in a single stylesheet:
@import url("node_modules/dhtmlx-gantt/codebase/dhtmlxgantt.css");You then switch between them at runtime, for example gantt.setSkin("dark"), rather than swapping stylesheets. Terrace is the default. You can also modify a skin or create your own custom skin by adjusting the CSS styling.
To load data into your DHTMLX Gantt chart, use the gantt.parse() or gantt.load() methods:
gantt.load("/data/data.json");Sync data changes to a backend using the DataProcessor API or the Gantt AJAX module.
Features
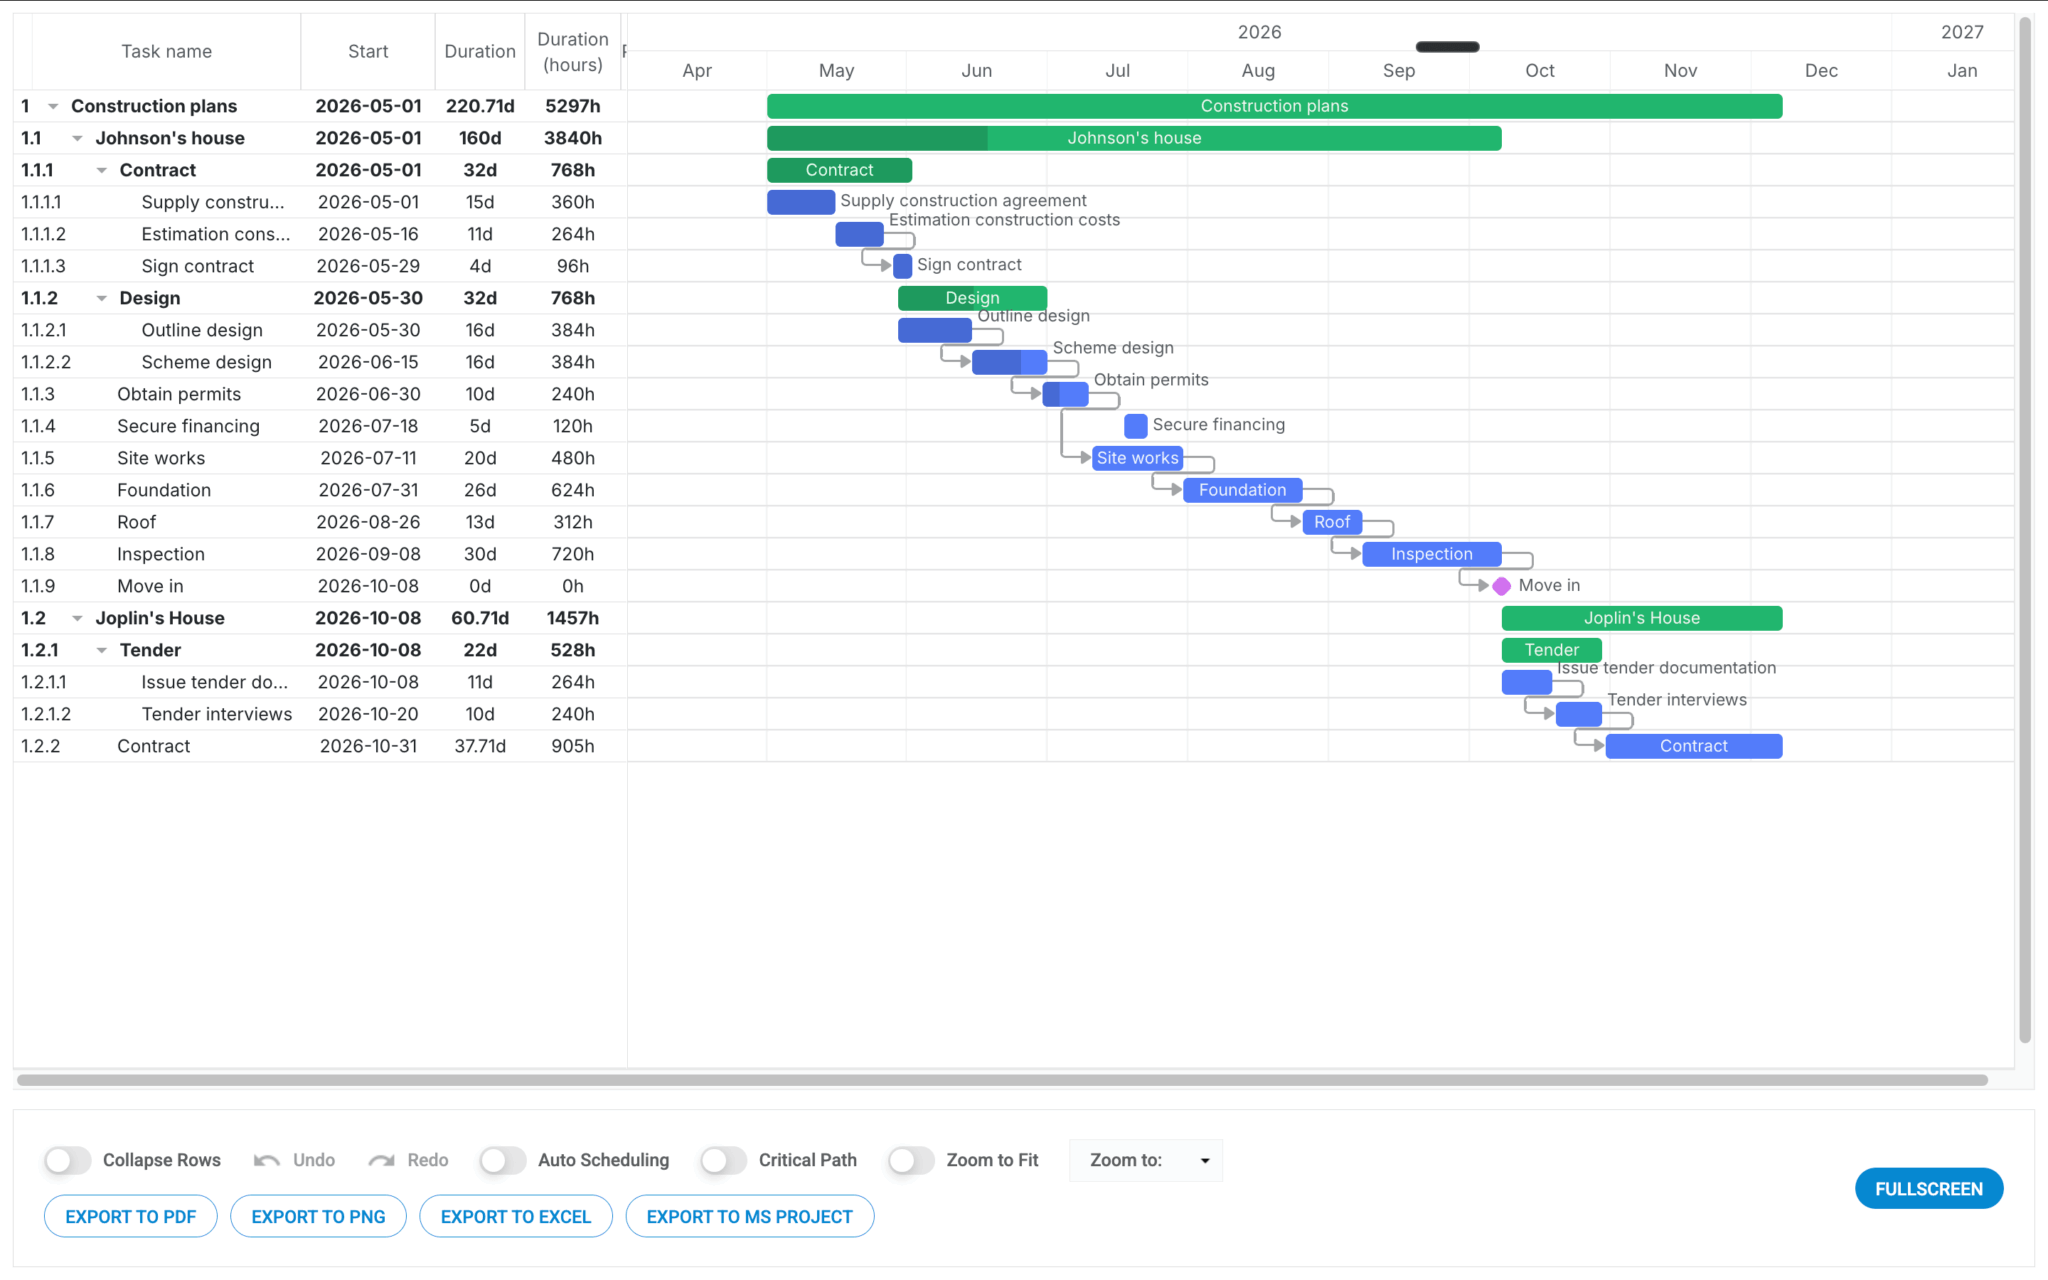
DHTMLX Gantt offers a lot of basic functionality out of the box such as adding, editing, and deleting tasks and dependencies (or “links”, as dependencies are referred to in DHTMLX Gantt).
DHTMLX Gantt is fully customizable and has substantial documentation. You can see the available features here and view demos of the features here. Advanced features include:
- Critical path calculation.
- Export to PDF, PNG, Excel, iCal, MS Project, or Primavera P6.
- Task autoscheduling using dependencies (links), eight constraint types, and backward scheduling.
- Working calendars at both the project and resource level.
- Integration with other DHTMLX project management tools, such as the DHTMLX To Do List.
- Large dataset handling and performance optimization.
- AI chat assistant that lets you interact with the Gantt chart using natural language.
- An MCP server that gives AI coding assistants access to up-to-date DHTMLX documentation, and agent skills.
DHTMLX has an active blog where you’ll find tutorials like Enhancing State Management in DHTMLX React Gantt with Jotai and customer spotlights detailing their experience with using DHTMLX components.
The DHTMLX Gantt chart is built with JavaScript and has no external dependencies.
Pricing
Licenses for DHTMLX components come with a year of support. Choose your license from the range of DHTMLX license options based on the size of your team and whether you’ll use the components in a SaaS product. A license for DHTMLX Gantt starts at $799 for an Individual license. The license is perpetual and comes with 1 year of updates and support. You can take advantage of DHTMLX bundle offers if you’d like to use several DHTMLX components. The licensed libraries are the PRO versions. DHTMLX also has an MIT-licensed, open-source standard library version of Gantt that’s free to use but has fewer features and no official support. You can see the differences between the standard and the PRO library features for DHTMLX Gantt here.
Pros
- DHTMLX Gantt has comprehensive documentation with good search filters and blog post tutorials.
- DHTMLX provides a selection of Gantt demos with source code, including integration with various frameworks. The demos page includes a text search filter.
- DHTMLX Gantt is highly customizable with many advanced features.
- DHTMLX Gantt integrates with many server-side platforms.
- DHTMLX Gantt shows high performance with large datasets.
- DHTMLX supports AI-assisted development with an MCP server and agent skills, and has an AI chat assistant for end users.
Cons
The predefined skins for styling DHTMLX Gantt charts are not as attractive as the themes for the Syncfusion and Bryntum Gantt chart libraries.
Syncfusion
Syncfusion is a commercial UI component library for web, desktop, and mobile apps. It has UI components, including a Gantt chart, for the popular JavaScript frameworks React, Angular, and Vue. Syncfusion also supports the non-JavaScript frameworks Blazor and Flutter, which are used for frontend web development.
Getting started
You have three options to install the Syncfusion Gantt:
- Download the Essential Studio JavaScript (Essential JS 2) build.
- Use a CDN.
- Use npm.
To create a Gantt chart, you create an instance of the Syncfusion Gantt and pass in the configuration object, which determines how the Gantt will look and where it will get data from.
import { Gantt } from "@syncfusion/ej2-gantt";

const ganttChart = new Gantt({
  columns: [{ field: "TaskName", headerText: "TASKS", width: "250" }],
});

ganttChart.appendTo("body");
The columns property is used to define the data column on the left side of the Gantt. The appendTo method takes in the DOM element that the Gantt chart will be added to as a child.
For basic data fetching, you can use the browser fetch API and pass the data to the dataSource property:
async function fetchGanttData() {
  try {
    const response = await fetch("/data/data.json");
    if (!response.ok) {
      throw new Error(`Error! Status: ${response.status}`);
    }
    const data = await response.json();
    return data;
  } catch (error) {
    console.error("Failed to fetch Gantt data:", error);
    return [];
  }
}

const dataSource = await fetchGanttData();
const ganttChart = new Gantt({
  dataSource: dataSource,
  ...
You can use DataManager to simplify getting and syncing data from a backend:
const dataSource = new DataManager({
  url: 'http://localhost:3001/api/ganttData',
  adaptor: new UrlAdaptor(),
  batchUrl: 'http://localhost:3001/api/batchData',
});
The taskFields property is required to get task details from a data source. It maps task property names to the task property names of the data source. This allows for some variability in the structure of the data source.
taskFields: {
    id: "Id",
    name: "TaskName",
    startDate: "StartDate",
    duration: "Duration",
    progress: "PercentDone",
    dependency: "Dependency",
    child: "Subtasks",
},
To style the Gantt, import one of the theme CSS stylesheets:
@import "@syncfusion/ej2/tailwind3.css";There are 13 built-in themes to choose from, with light and dark variants, including Material 3, Fluent 2, and Tailwind 3.4. You can also customize themes using the Theme Studio for Essential JS 2 GUI.
Features
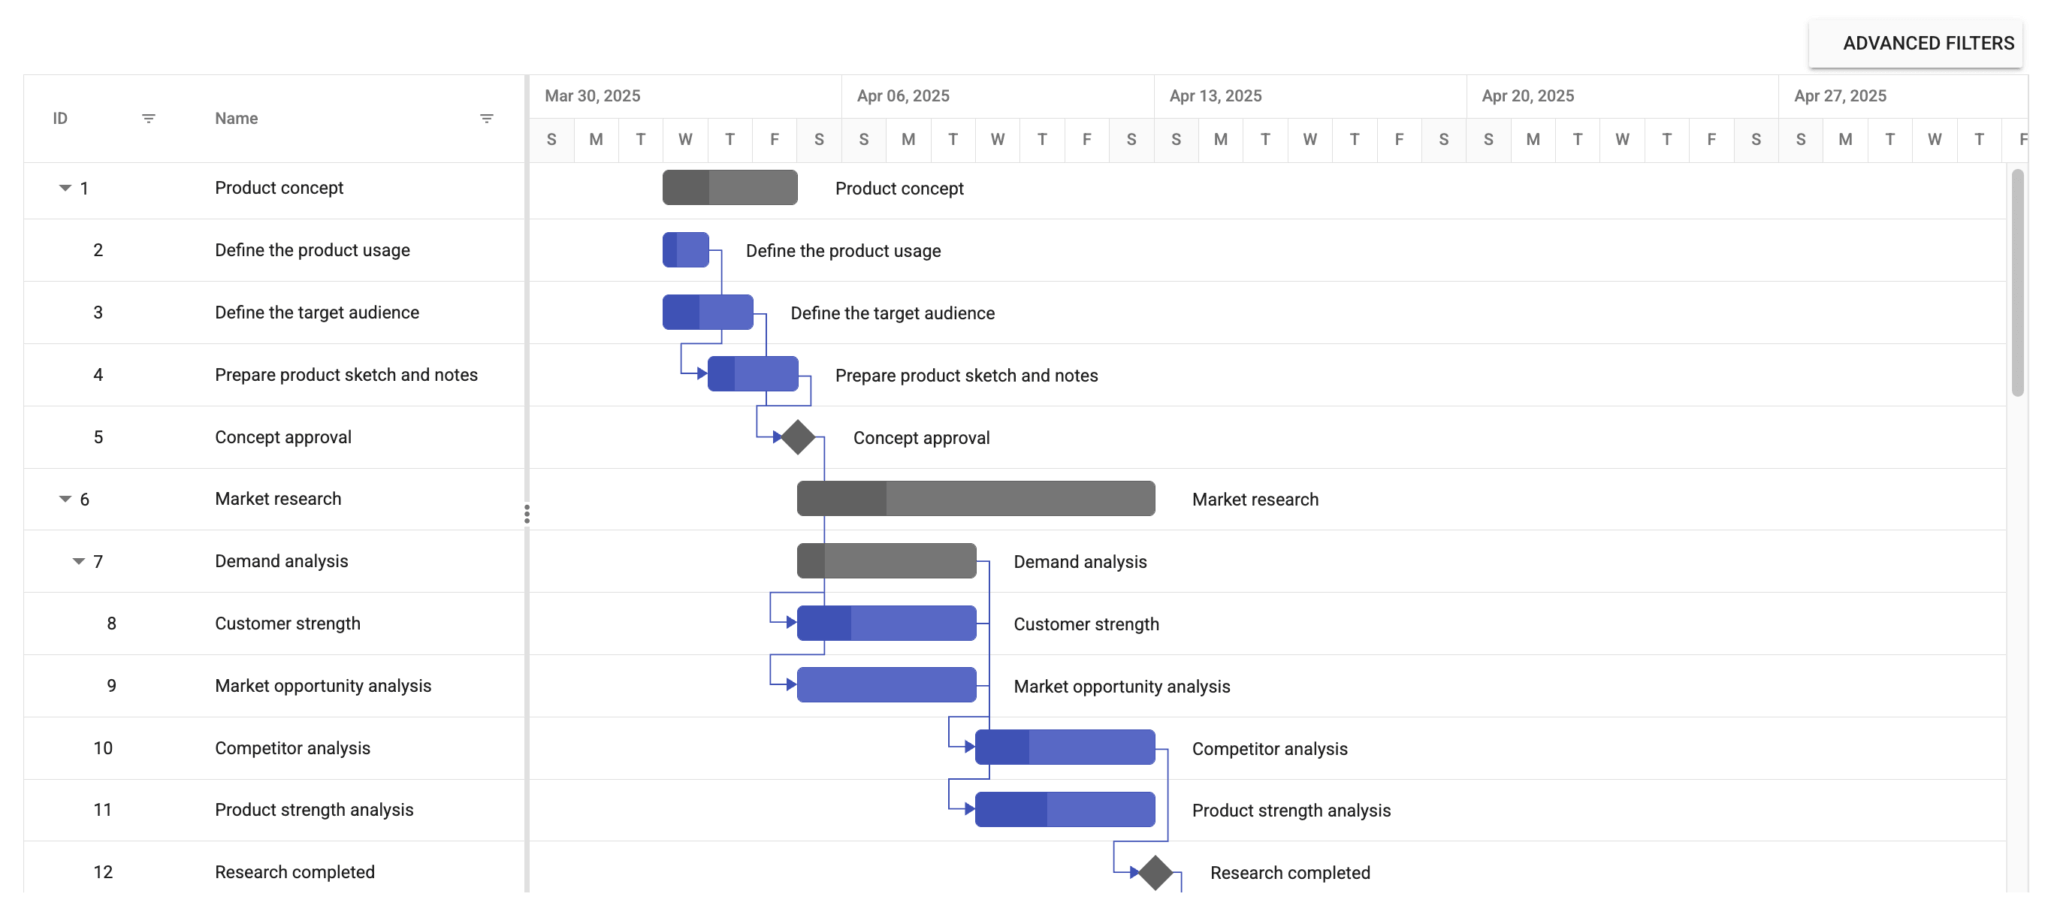
The Syncfusion Gantt chart is mobile touch-friendly, responsive, and built with accessibility in mind. It’s keyboard navigable and has WAI-ARIA accessibility support. The theme editor GUI makes for easy customization of the Gantt styling.
Syncfusion has an active blog, and Syncfusion Gantt has comprehensive documentation and a demos page that shows the features of the Gantt.
Syncfusion Gantt has many features that make it suitable for creating complex Gantt charts, including:
- Critical path calculation.
- Exporting data to Excel, PDF, and CSV formats.
- Undo and redo functionality.
- Virtual scrolling for improved performance with large datasets.
- An AI chat feature that lets users interact with the Gantt using natural language.
- An MCP server and AI skills that help AI coding assistants generate accurate Syncfusion code.
Pricing
Syncfusion UI components are sold as bundles, billed monthly or annually with a minimum one-year subscription. Pricing is quote-based rather than a fixed public price, so you’ll need to contact Syncfusion’s sales team for a number. Paid-for licenses include support and unlimited ticket creation,. There is a free community license for companies with less than $1 million in annual gross revenue, five or fewer developers, ten or fewer total employees, and that have not received more than $3 million in capital from an outside source. You can sign up for a 30-day free trial of Syncfusion, which includes the same support services as licensed customers.
Pros
- The Syncfusion Gantt demos page includes source code and links to API documentation, and you can edit the demos on StackBlitz.
- Syncfusion has comprehensive documentation for the Gantt component.
- Syncfusion supports multiple web frameworks, including non-JavaScript frameworks.
- The Syncfusion Gantt is highly customizable with many advanced features.
- The Syncfusion theme editor GUI makes for easy theme customization.
- Syncfusion has good support services.
- Syncfusion supports AI-assisted development with an MCP server and AI skills, and offers an AI chat feature for end users.
Cons
Syncfusion Gantt is an expensive choice if you don’t qualify for the community license or only want to use the Gantt chart or a few of the Syncfusion components.
JSCharting
JSCharting is a commercial JavaScript chart library with over 150 types of charts, including Gantt. Like Frappe Gantt, JSCharting renders charts with SVG and HTML5. You can use JSCharting with the popular JavaScript frameworks React, Angular, and Vue, and it has a JSCharting PHP bundle to simplify connecting a JSCharting Gantt to a PHP backend that uses a MySQL database.
Getting started
You have three options to install JSCharting:
- Download the package.
- Use a CDN.
- Use npm.
Once you have installed JSCharting, you create a Gantt chart by creating an instance of the JS chart object using the chart() function. The first argument of this function is the id of the HTML element or the element object that this chart will be added to as a child. The second argument is the Gantt configuration object:
import * as JSC from "jscharting";

JSC.chart("app", {
  type: "horizontal column",
  zAxis_scale_type: "stacked",
  xAxis_scale_type: "time",
});
The property type is set to "horizontal column" for a Gantt chart. The stacked z-axis scale type makes series data points with the same x values take up the same space on the x-axis. JSCharting uses series data to represent tasks or events. Each item in the series data is a task or event with a specific start and end date.
The underscore syntax is a feature of JSCharting called code expansion that allows you to combine nested property paths into a single property name:
zAxis_scale_type: "stacked",
// is equivalent to:
zAxis: { scale: { type: "stacked" }  },
There are many other configuration properties, for example, to customize the legend, axes, and colors.
To fetch data, you can use the browser fetch API and pass the data to the series property:
fetch("./data/data.json")
  .then(function (response) {
    return response.json();
  })
  .then(function (json) {
    chart = renderChart(json);
  });

function renderChart(data) {
  return JSC.chart("app", {
    ...
    series: data,
  });
}
JSCharting has utility functions for converting between JSON and delimiter-separated values such as CSV. You can convert data to chartable series and points with the nest object.
Features
JSCharting charts are optimized for touch screen and mobile devices, with responsive styling and good accessibility compliance.
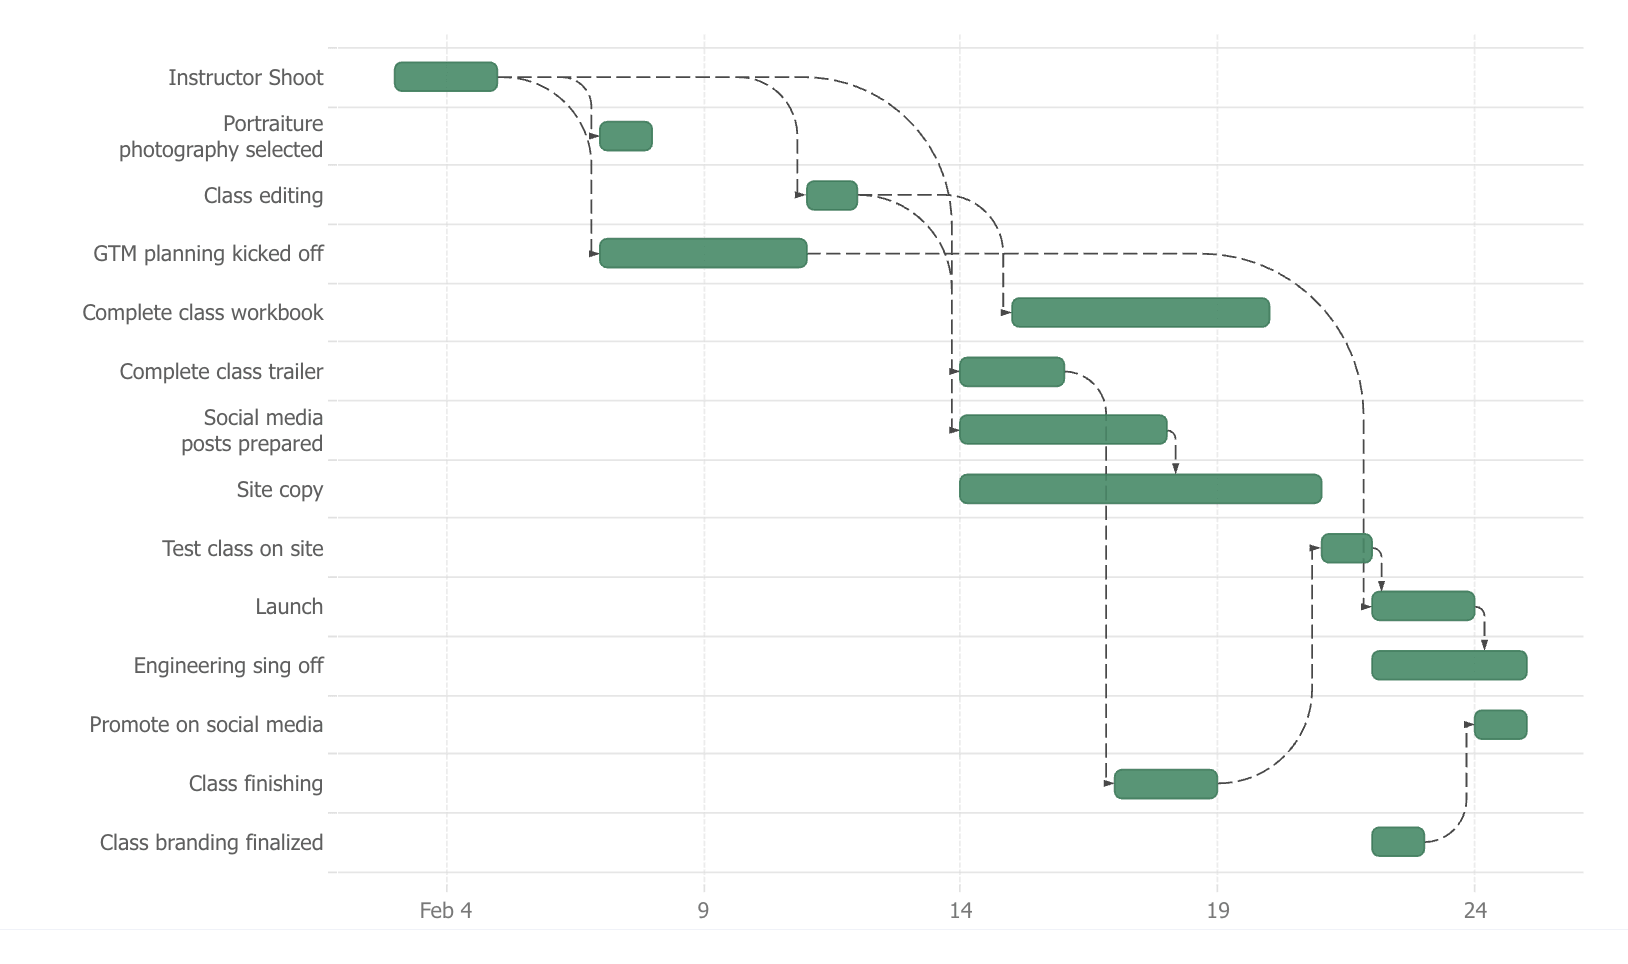
The JSCharting Gantt chart demos page includes many examples you can use as a starting point, including circular Gantt charts, a linear gauge Gantt, and a scrollable HTML timeline view. Each demo has vanilla JavaScript source code, and you can use the JSCharting editing UI to change the demo code, as you can see in this complex Gantt chart demo. Some demos show advanced features like critical dependency paths and progress line overlays.
Pricing
The JSCharting bundle license includes all 150+ chart types and costs $995 per developer, including priority support, upgrades, and new releases for one year. JSCharting sells JSGantt as a standalone license at $395 per developer. You can register on the JSCharting website to qualify for a free license for non-commercial use with no time restrictions. A Gantt chart created using the free JSCharting license features a small watermark icon that links to the JSCharting website.
Pros
- The JSCharting touch screen and mobile device optimization is a plus.
- JSCharting has good accessibility compliance.
- The JSCharting bundle includes many other charts that you may want to use.
- You’ll find many example Gantt charts on the JSCharting demos page.
Cons
- Because a JSCharting chart is an SVG, it’s not easy to customize, for example, changing the date rows of a chart.
- The out-of-the-box JSCharting UI design looks outdated.
- The JSCharting Gantt is relatively simple and unsuitable for more complex Gantt charts.
- The documentation for the JSCharting Gantt is not very detailed.
Frappe
Frappe Gantt is a simple, open-source Gantt chart library. Like JSCharting, Frappe Gantt renders charts with SVG and HTML5.
Getting started
You can install the Frappe Gantt library using npm or a CDN script.
To get started, add a container element to your page and initialize a new Gantt object:
let gantt = new Gantt("#gantt", tasks, {
  view_mode: "Day",
});
The first argument of the Gantt constructor function is a CSS selector (or element reference) for the container that will hold your Gantt chart. The second argument is the tasks data. The third argument is a configuration object that determines how the Gantt chart looks and functions.
The view_mode determines the view of the Gantt chart. The built-in values are “Day”, “Week”, “Month”, and “Year”, and you can also define fully custom view modes with your own step size and header labels.
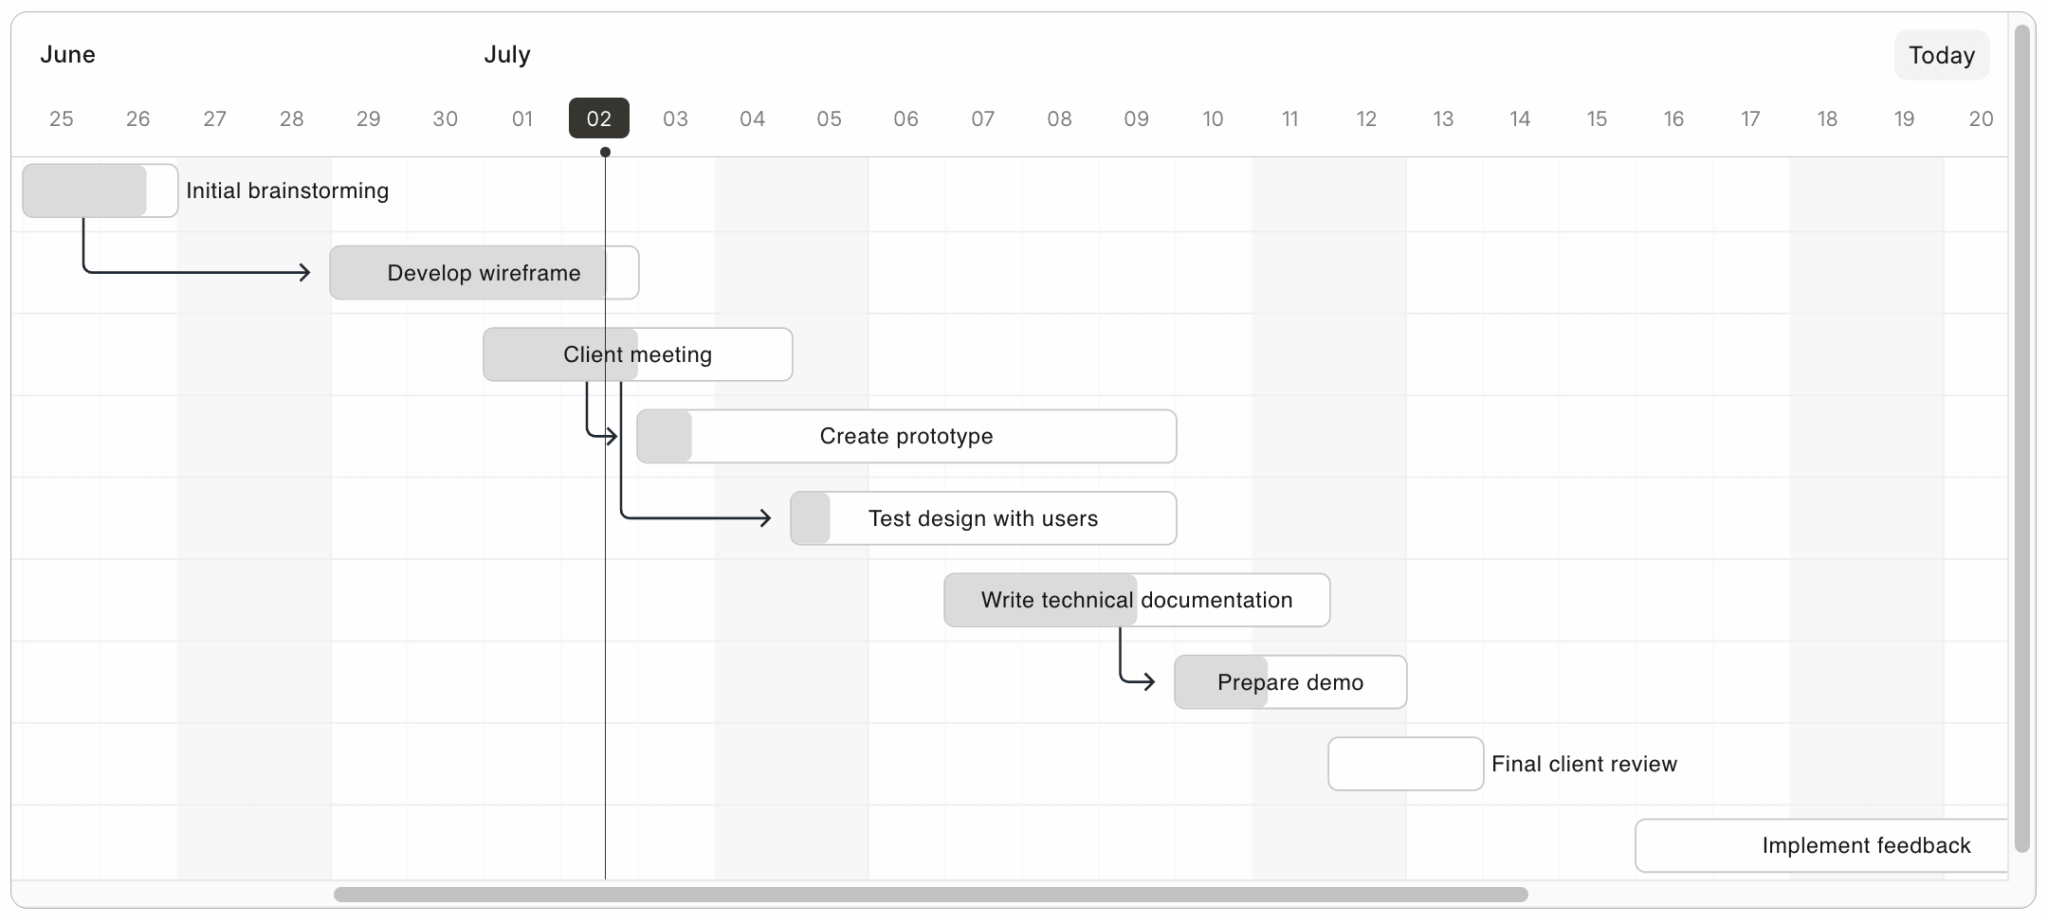
You can change view_mode using the change_view_mode method. Frappe Gantt also has built-in drag-and-drop for moving tasks and adjusting progress, and you can draw dependency lines between tasks. You can add event listeners or customize the HTML popup that displays when you click on a taskbar. If you want functionality beyond that, such as adding or deleting tasks through a UI, you’ll need to code it yourself.
Features
A Frappe Gantt chart is a simple chart with basic features:
- Drag-and-drop editing of task dates and progress, plus dependency lines between tasks.
- Nearly 30 configuration options, including “bar_height”, “arrow_curve”, “language” (with multi-lingual support), and holiday/weekend marking.
- Built-in and fully custom view modes.
- Event listeners.
- Custom HTML in the task bar popup.
Pricing
Frappe Gantt is a free, open-source library.
Pros
- Frappe Gantt is open source and free to use.
- Frappe Gantt is a good option if you need a very basic Gantt chart.
Cons
- The Frappe Gantt documentation is one short demo page and the GitHub repo readme.
- Like the JSCharting Gantt chart, the Frappe Gantt chart is not easy to customize (for example, changing the date rows) because it is an SVG.
- Frappe Gantt has a very simple API that lacks a lot of basic functionality that’s commonly used in Gantt charts, such as adding, editing, or deleting tasks. If you want extra functionality, you’ll have to build it yourself.
- You can only use vanilla JavaScript with Frappe Gantt.
Comparison
Below is a table comparing some of the features of the five Gantt chart libraries:
| Bryntum | DHTMLX | Syncfusion | JSCharting | Frappe | |
|---|---|---|---|---|---|
| Easy to customize | ✔️ | ✔️ | ✔️ | ❌ | ❌ |
| Advanced features | ✔️ | ✔️ | ✔️ | ✔️ | ❌ |
| Data fetching helpers | ✔️ | ✔️ | ✔️ | ✔️ | ❌ |
| Handle large data sets | ✔️ | ✔️ | ✔️ | ❌ | ❌ |
| Styling themes | ✔️ | ✔️ | ✔️ | ❌ | ❌ |
| Theme builder GUI | ❌ | ❌ | ✔️ | ❌ | ❌ |
| Open source | ❌ | ✔️* | ❌ | ❌ | ✔️ |
| Accessibility | ✔️ | ✔️ | ✔️ | ✔️ | ❌ |
| React, Angular, and Vue support | ✔️ | ✔️ | ✔️ | ✔️ | ❌ |
| TypeScript support | ✔️ | ✔️ | ✔️ | ✔️ | ❌ |
| Split tasks | ✔️ | ✔️ | ✔️ | ❌ | ❌ |
| Undo / redo functionality | ✔️ | ✔️ | ✔️ | ❌ | ❌ |
| Handle dependency conflicts | ✔️ | ❌ | ✔️ | ❌ | ❌ |
| Summary bar | ✔️ | ❌ | ❌ | ❌ | ❌ |
| Import Excel | ❌ | ✔️ | ❌ | ❌ | ❌ |
| Export Excel | ✔️ | ✔️ | ✔️ | ❌ | ❌ |
| AI chat feature | ✔️ | ✔️ | ✔️ | ❌ | ❌ |
| MCP server | ✔️ | ✔️ | ✔️ | ❌ | ❌ |
| AI skills | ✔️ | ✔️ | ✔️ | ❌ | ❌ |
* Only for the standard (MIT-licensed) library, not the PRO library.
Of the libraries we test drove, Bryntum Gantt has the most features out of the box with considered touches like summary rows and task-dependency management. Bryntum Gantt also has the most appealing visual appearance, with Syncfusion coming in a close second.
Bryntum Gantt and Syncfusion Gantt both have built-in UIs to edit dependencies, but DHTMLX Gantt doesn't.
If your budget is limited, the best free, open-source Gantt chart is the standard library version of the DHTMLX Gantt chart. Small start-ups that qualify for the free community license might prefer Syncfusion Gantt, but Syncfusion Gantt is an expensive option if you only need their Gantt chart component. Frappe Gantt is good if you want a simple Gantt chart.
DHTMLX Gantt was the easiest to link up with a backend, as its dataProcessor simplifies CRUD API endpoints, and there's a single CRUD operation per API request. Bryntum Gantt and Syncfusion Gantt backend integrations use multiple CRUD operations per request, which can improve performance, but it makes handling requests more complex.
AI support is another differentiator. Bryntum, DHTMLX, and Syncfusion each offer an AI chat feature that lets users work with the Gantt in natural language, an MCP server that gives AI coding assistants up-to-date knowledge of their APIs, and AI skills for tools like Claude Code, Cursor, and GitHub Copilot.
However, if you need to build complex Gantt charts or work with large datasets, Bryntum Gantt, DHTMLX Gantt, and Syncfusion Gantt are the most suitable options. Each library offers different features, so you'll need to consider your requirements and check the features and demo pages of the various Gantt chart libraries to see which is most suitable.
Frequently Asked Questions
To wrap up the comparison, here are quick answers to the questions that usually come up when choosing a JavaScript Gantt chart library for a real project.
What is the best JavaScript Gantt chart library?
It depends on your requirements and budget. Of the libraries we compared, Bryntum Gantt has the most complete feature set and the most polished UI, making it the best choice for complex project management apps. DHTMLX Gantt and Syncfusion Gantt are also strong commercial options, and Frappe Gantt is a good free choice for simple charts.
Are there free, open-source JavaScript Gantt chart libraries?
Yes. Frappe Gantt is MIT-licensed and free to use, and DHTMLX offers an MIT-licensed standard edition of its Gantt chart with a reduced feature set. Syncfusion has a free community license for small companies that meet its eligibility criteria.
Which JavaScript Gantt chart libraries work with React, Angular, and Vue?
Bryntum, DHTMLX, Syncfusion, and JSCharting all support React, Angular, and Vue.
Can JavaScript Gantt chart libraries handle large projects?
Bryntum Gantt, DHTMLX Gantt, and Syncfusion Gantt are all built to handle large datasets, using techniques like fast rendering engines and virtual scrolling to keep the UI responsive with thousands of tasks.
Do any JavaScript Gantt chart libraries have AI features?
Yes. Bryntum, DHTMLX, and Syncfusion each offer an AI chat feature that lets users interact with the Gantt using natural language, as well as an MCP server and AI skills that help AI coding assistants like Claude Code and Cursor generate accurate code.
Build it with Bryntum Gantt
Start a free trial, explore live demos, or read the docs.