Customer spotlight: TopLeft
We strive to keep posts updated, but code samples may sometimes be outdated. Humans, see the Bryntum documentation; agents, https://mcp.bryntum.com for the latest info.
By Matt Fox, VP Product & Engineering, TopLeft
TopLeft gives IT managed service providers (MSPs) a better way to see and plan their work. MSPs run their businesses in professional services automation (PSA) software such as ConnectWise PSA, Datto Autotask, and HaloPSA. The PSA tracks projects, tasks, service tickets, and schedules. However, its screens are typically more like Excel and are not visual.
Some MSPs try to visualize their work with tools such as Microsoft Planner, monday.com, and Jira, which are not integrated with their main software. TopLeft syncs that data and presents it as Kanban views, Gantt charts, capacity plans, calendars, and project health dashboards. We provide full two-way data synchronization.
Moving from Syncfusion to Bryntum
Our first Gantt chart, in 2023, used Syncfusion. We needed something better, and we had a list of visuals we wanted to add: capacity planning, a Gantt chart with a critical path, and calendar views. Bryntum’s range of components and its library of examples showed us that one suite could cover all of it, so we decided to go all-in.
Capacity planning came first, using Bryntum Scheduler Pro. In early 2026, we rebuilt the Gantt chart using Bryntum Gantt and removed Syncfusion. Now we are working on deploying more features and visuals such as dispatching, calendars, and Kanban boards.
Performance and customization
Performance was one of the key requirements. MSPs plan across thousands of tickets and tasks, and being able to load all of them in one view is something that sets TopLeft apart. Bryntum handles that volume with ease.
We also needed to make the components our own. TopLeft has its own way of presenting MSP work, and Bryntum’s configuration and extension points let us tailor all the visuals to our users’ needs without being hamstrung by the framework.
We didn’t want our developers spending their time deep in JavaScript and HTML building charts from scratch either. We’re a small team, and we don’t have time for that. With Bryntum, their time goes into the MSP-specific work: syncing the PSAs and deciding what each view should show.
Built on Bryntum
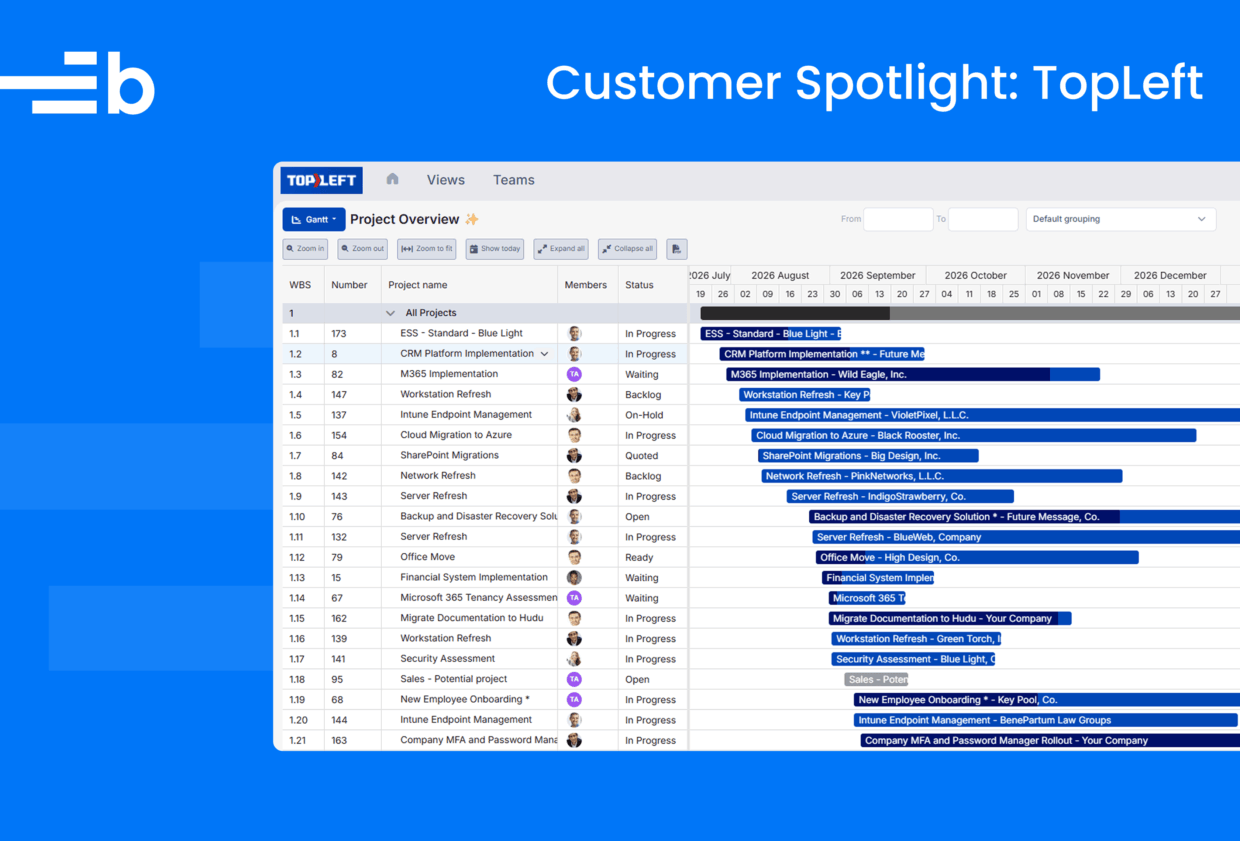
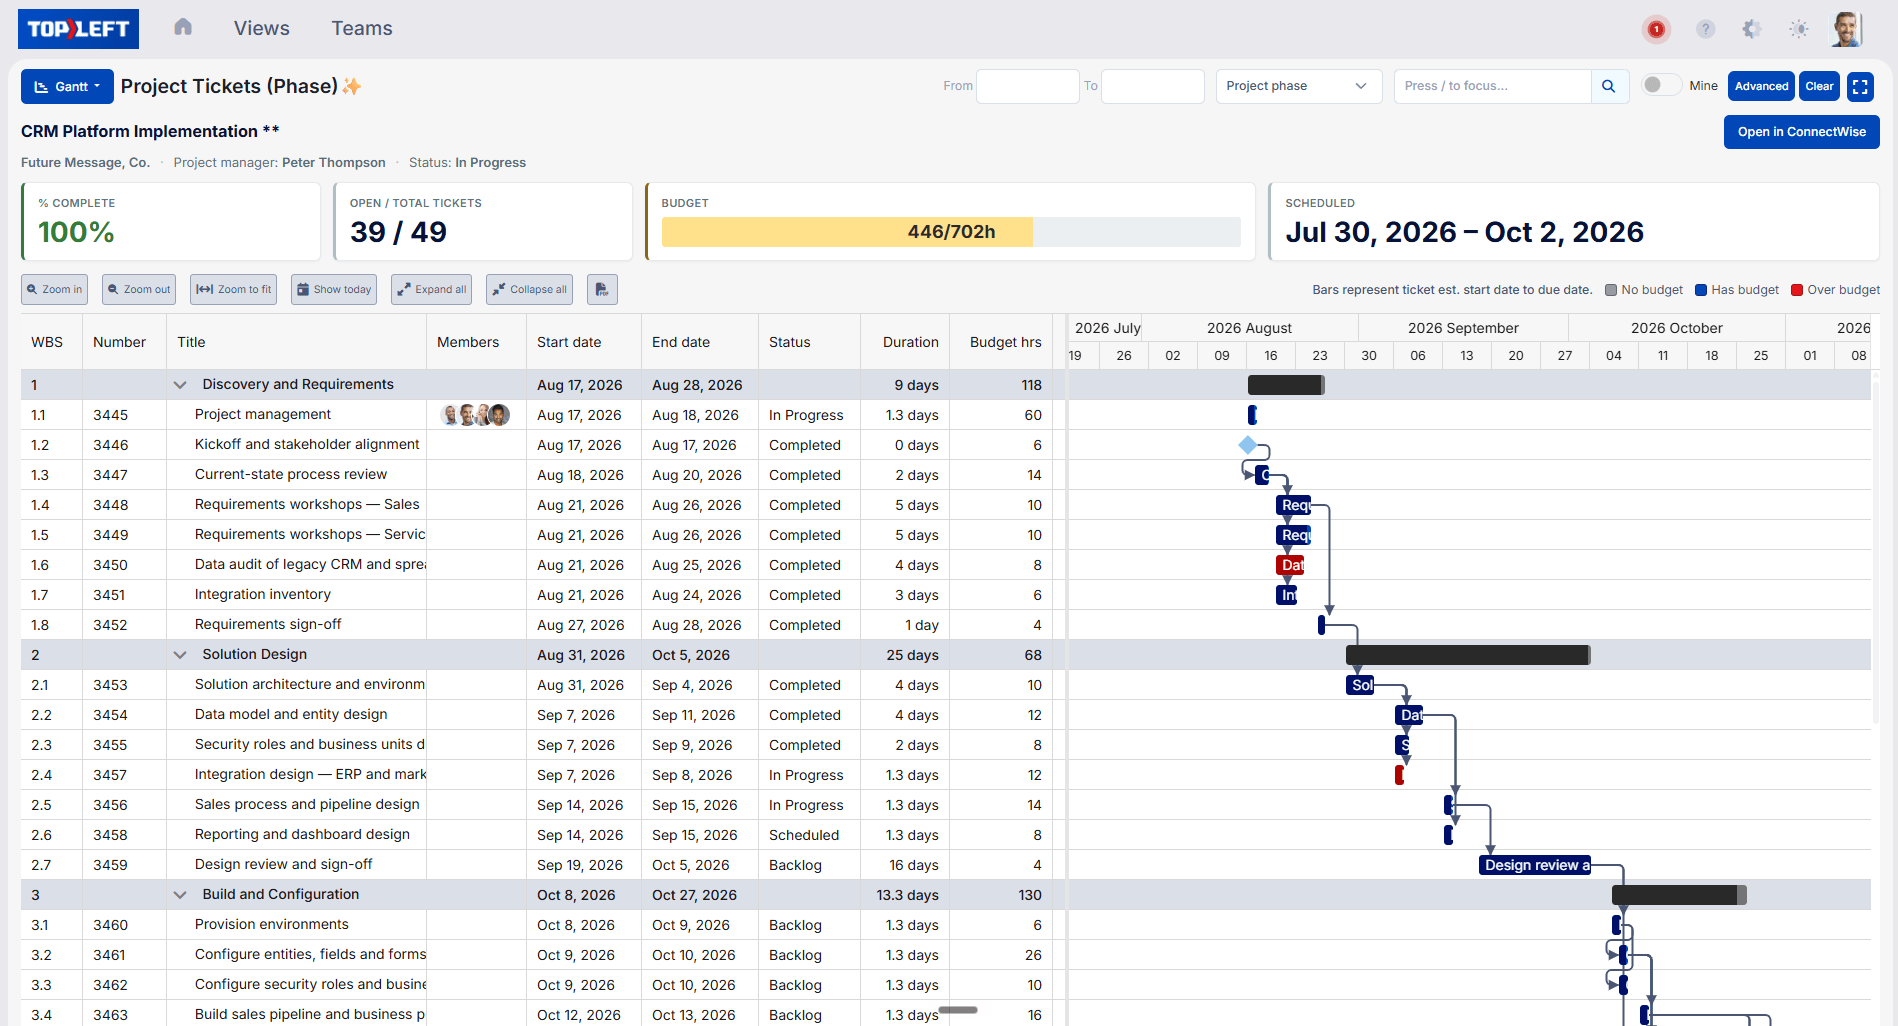
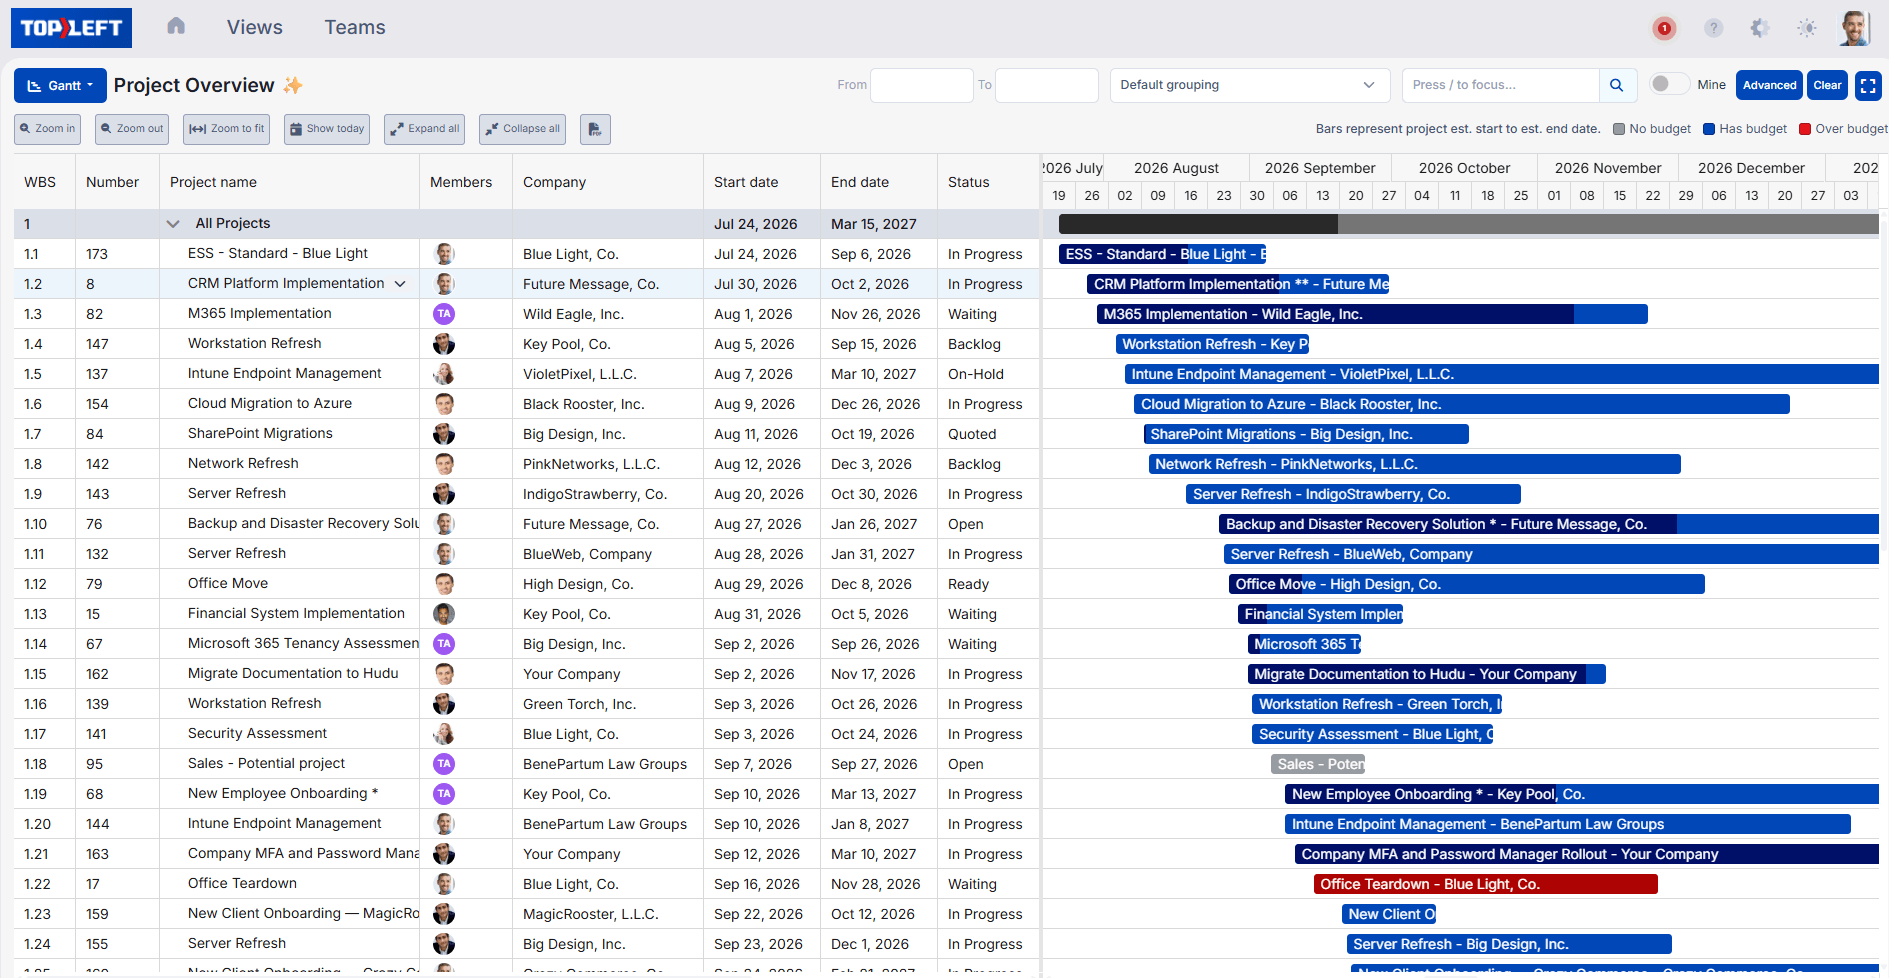
Project Gantt. Projects, phases, tickets, and tasks from the PSA appear on a timeline with their dependencies and critical path. Project managers drag bars to reschedule work and draw dependency links directly on the chart.
Capacity planning. Bryntum Scheduler Pro shows each engineer’s booked work over time, so dispatchers can see who is overbooked before the week starts.
Calendar. Bryntum Calendar shows scheduled work by day, week, or month.
Project Health. A portfolio grid built with Bryntum Grid lists every active project with its schedule and budget signals, so a service manager can sort the projects that need attention first.
Light and dark mode
Dark mode was one of our most requested features. Bryntum’s theming let us offer the Gantt chart, scheduler, calendar, and grids in both light and dark mode, matching the rest of TopLeft.
Integration
TopLeft is a Django application with a TypeScript front end. The Bryntum components are bundled with webpack and fed from Django endpoints, which hide the differences between the PSA software products we integrate with. This allows us to provide consistent Gantt, scheduling, and other visuals without Bryntum needing to know where the data comes from. We are also now using AI coding to accelerate the integration of more visuals into our application.
Results
Our clients love the new visuals. MSP teams now see their PSA work as a plan instead of a list: Project managers can optimize project timelines without fighting their PSA, and sales teams can finally understand how much capacity their team has for projects and avoid overpromising.
Build it with Bryntum Gantt
Start a free trial, explore live demos, or read the docs.