Migrate from Microsoft Project to Microsoft SharePoint and Bryntum Gantt

We strive to keep posts updated, but code samples may sometimes be outdated. Humans, see the Bryntum documentation; agents, https://mcp.bryntum.com for the latest info.
Microsoft Project for the web was retired in August 2025. It’s been added to Microsoft Planner. Luckily, no migration or change in licensing is required. Opening Microsoft Project redirects you to Microsoft Planner, where you can find all your previously created plans.
The Planner plan is the same as the Project plan. The Timeline view shows a Gantt chart:
However, the Microsoft Planner Gantt chart lacks features such as:
- Resolving or postponing scheduling conflicts
- Checking the rate of progress with an S-curve
- Advanced filtering
- Rendering and styling customization
It also requires a paid Planner plan, which starts at $10 per user per month.
To get around these limitations, you can instead use Bryntum Gantt, a feature-rich Gantt chart component that can be used with your frontend framework of choice: React, Angular, or Vue. You can connect and sync Bryntum Gantt to Microsoft Project or save some money and use the Bryntum Gantt with Microsoft SharePoint instead. Microsoft SharePoint is a collaborative, web-based platform for storing, organizing, and sharing information, documents, and files. You likely already have access to Microsoft SharePoint, which is included in the Microsoft 365 Business plan.
In this tutorial, we’ll show you how to migrate a Microsoft Project plan to a Bryntum Gantt on a Microsoft SharePoint page.
Prerequisites
If you don’t already have a Microsoft Planner subscription, you need to subscribe to one of the paid Microsoft Planner and Project plans. You can try the Planner Plan 1 or the Planner and Project Plan 3 for free for one month.
You also need to set up a Microsoft 365 tenant to build and deploy client-side web apps using the SharePoint Framework. If you already have a Microsoft 365 tenant, create an app catalog site.
If you don’t have a Microsoft 365 tenant, you might qualify for one through the Microsoft 365 Developer Program. Alternatively, you can sign up for a one-month Microsoft 365 Business Premium trial to get a Microsoft 365 tenant. Signing up for the trial requires entering your credit card details. You can cancel recurring billing right away to prevent being charged. If you use a work email address, some countries require that you provide your company’s tax reference number.
Creating a Microsoft Planner plan
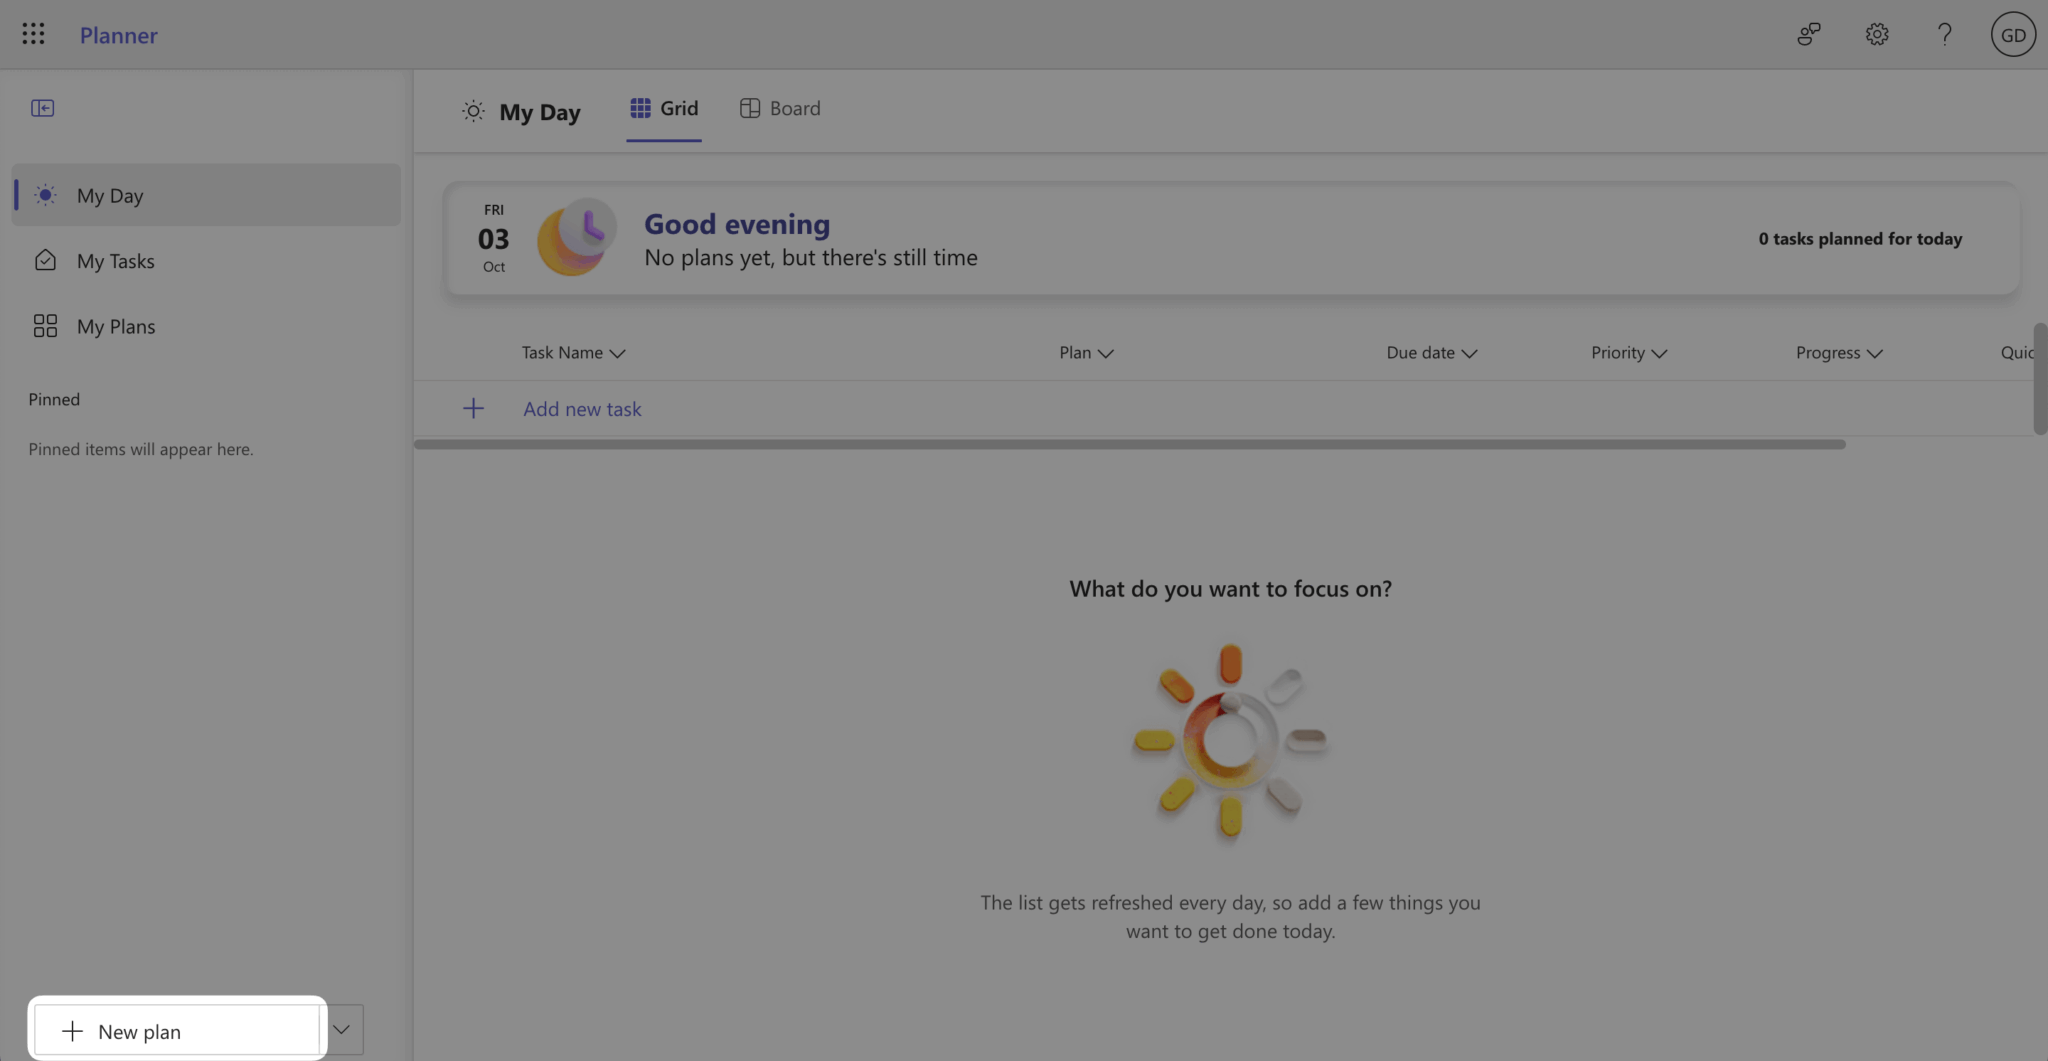
If you don’t already have a Microsoft Planner plan, create one by signing in to Microsoft Planner. Click the + New plan button at the bottom-left corner of your screen.
Select the + Premium option in the Create new dialog that opens.
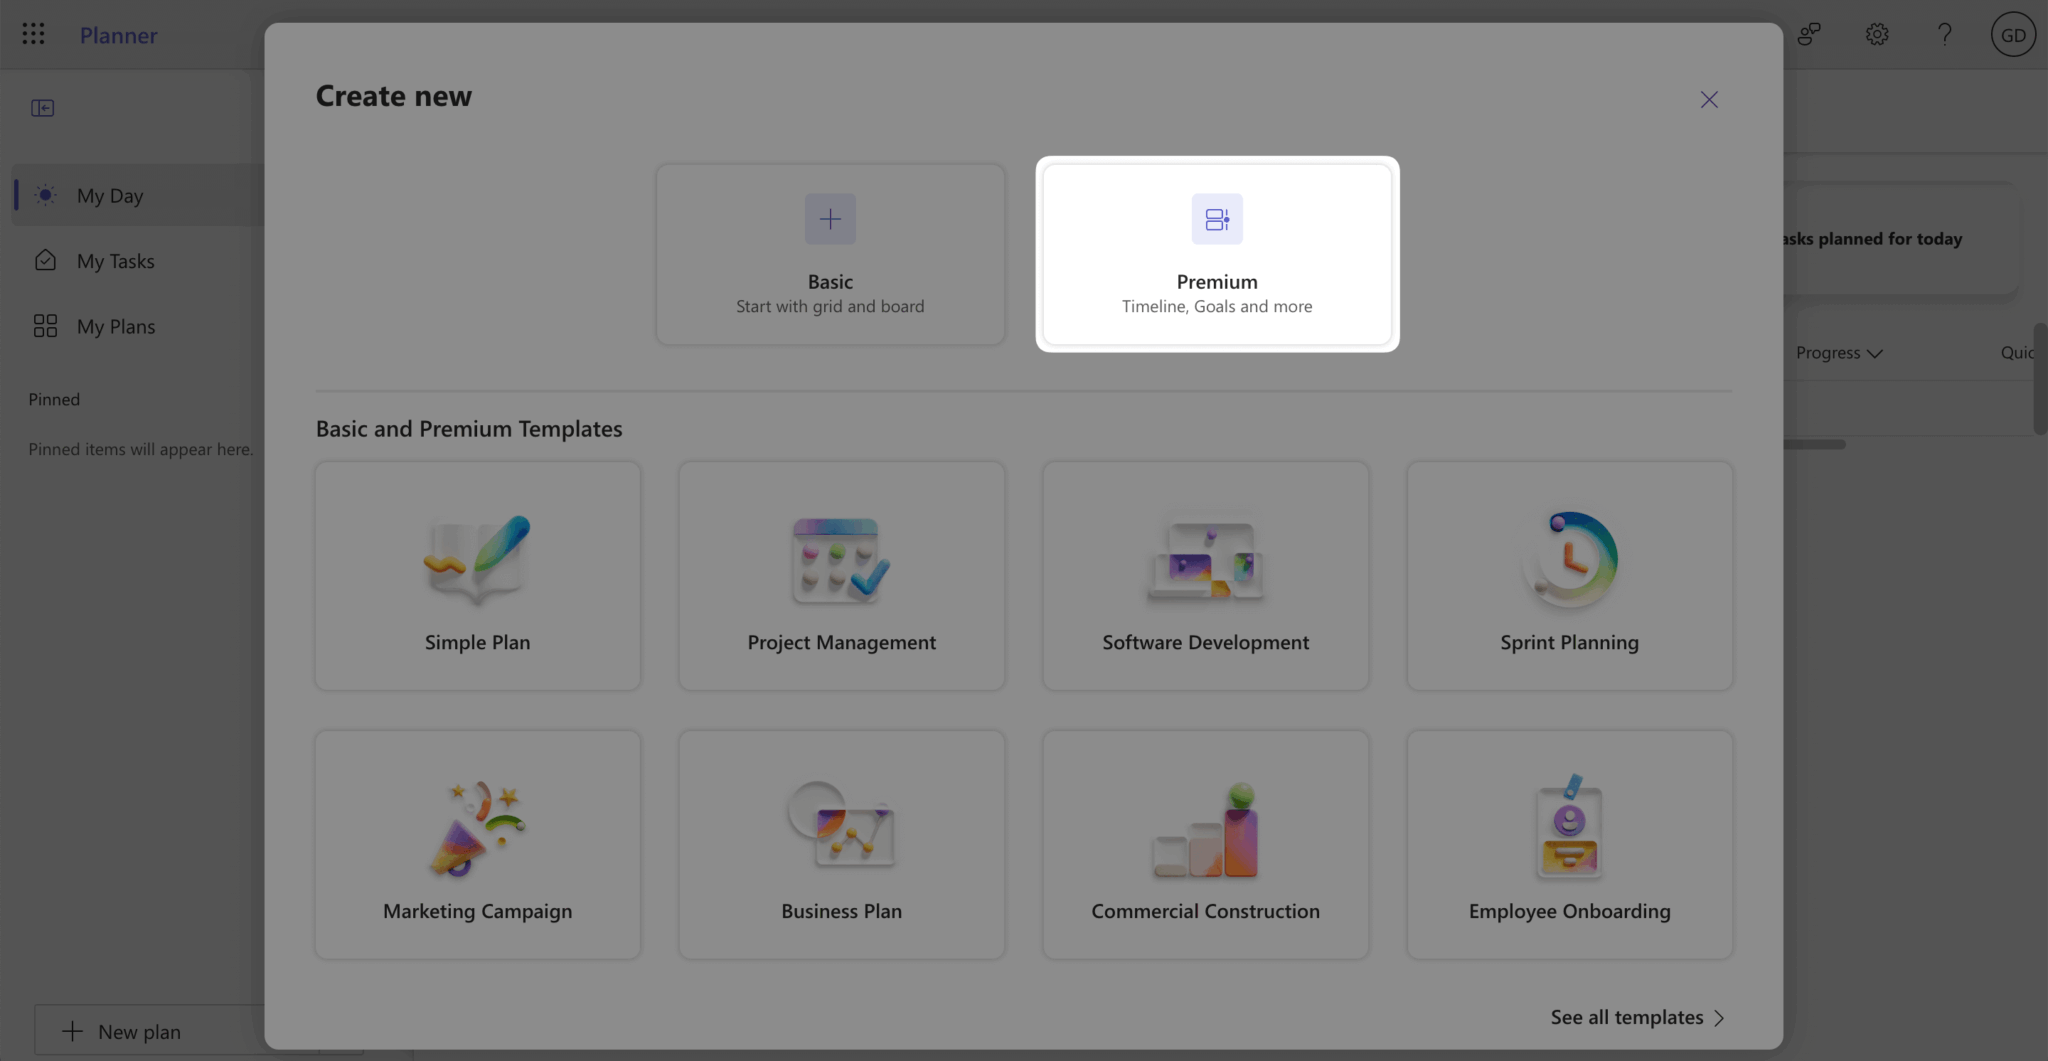
The plan has four different views: Grid, Board, Timeline, and Charts.
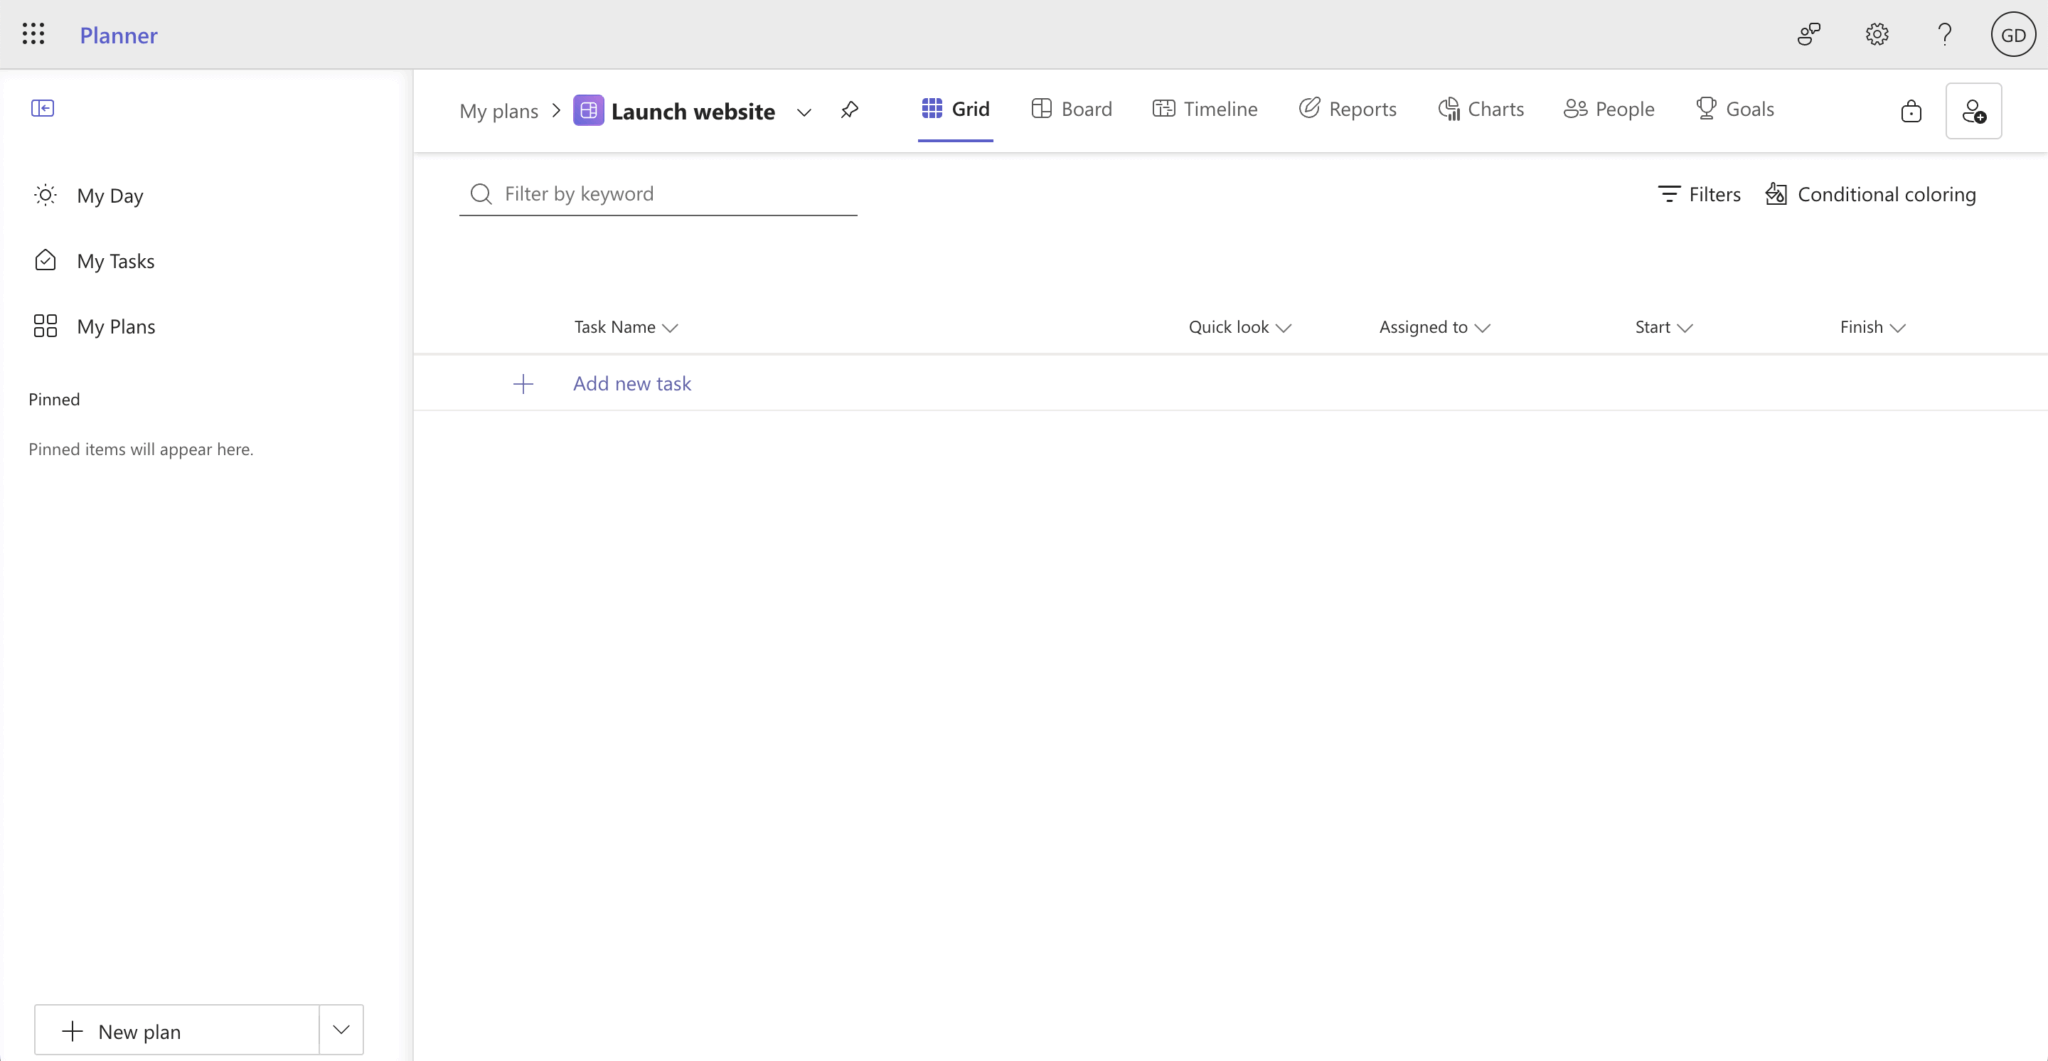
Open the Timeline tab to see a Gantt chart, and create some example tasks.
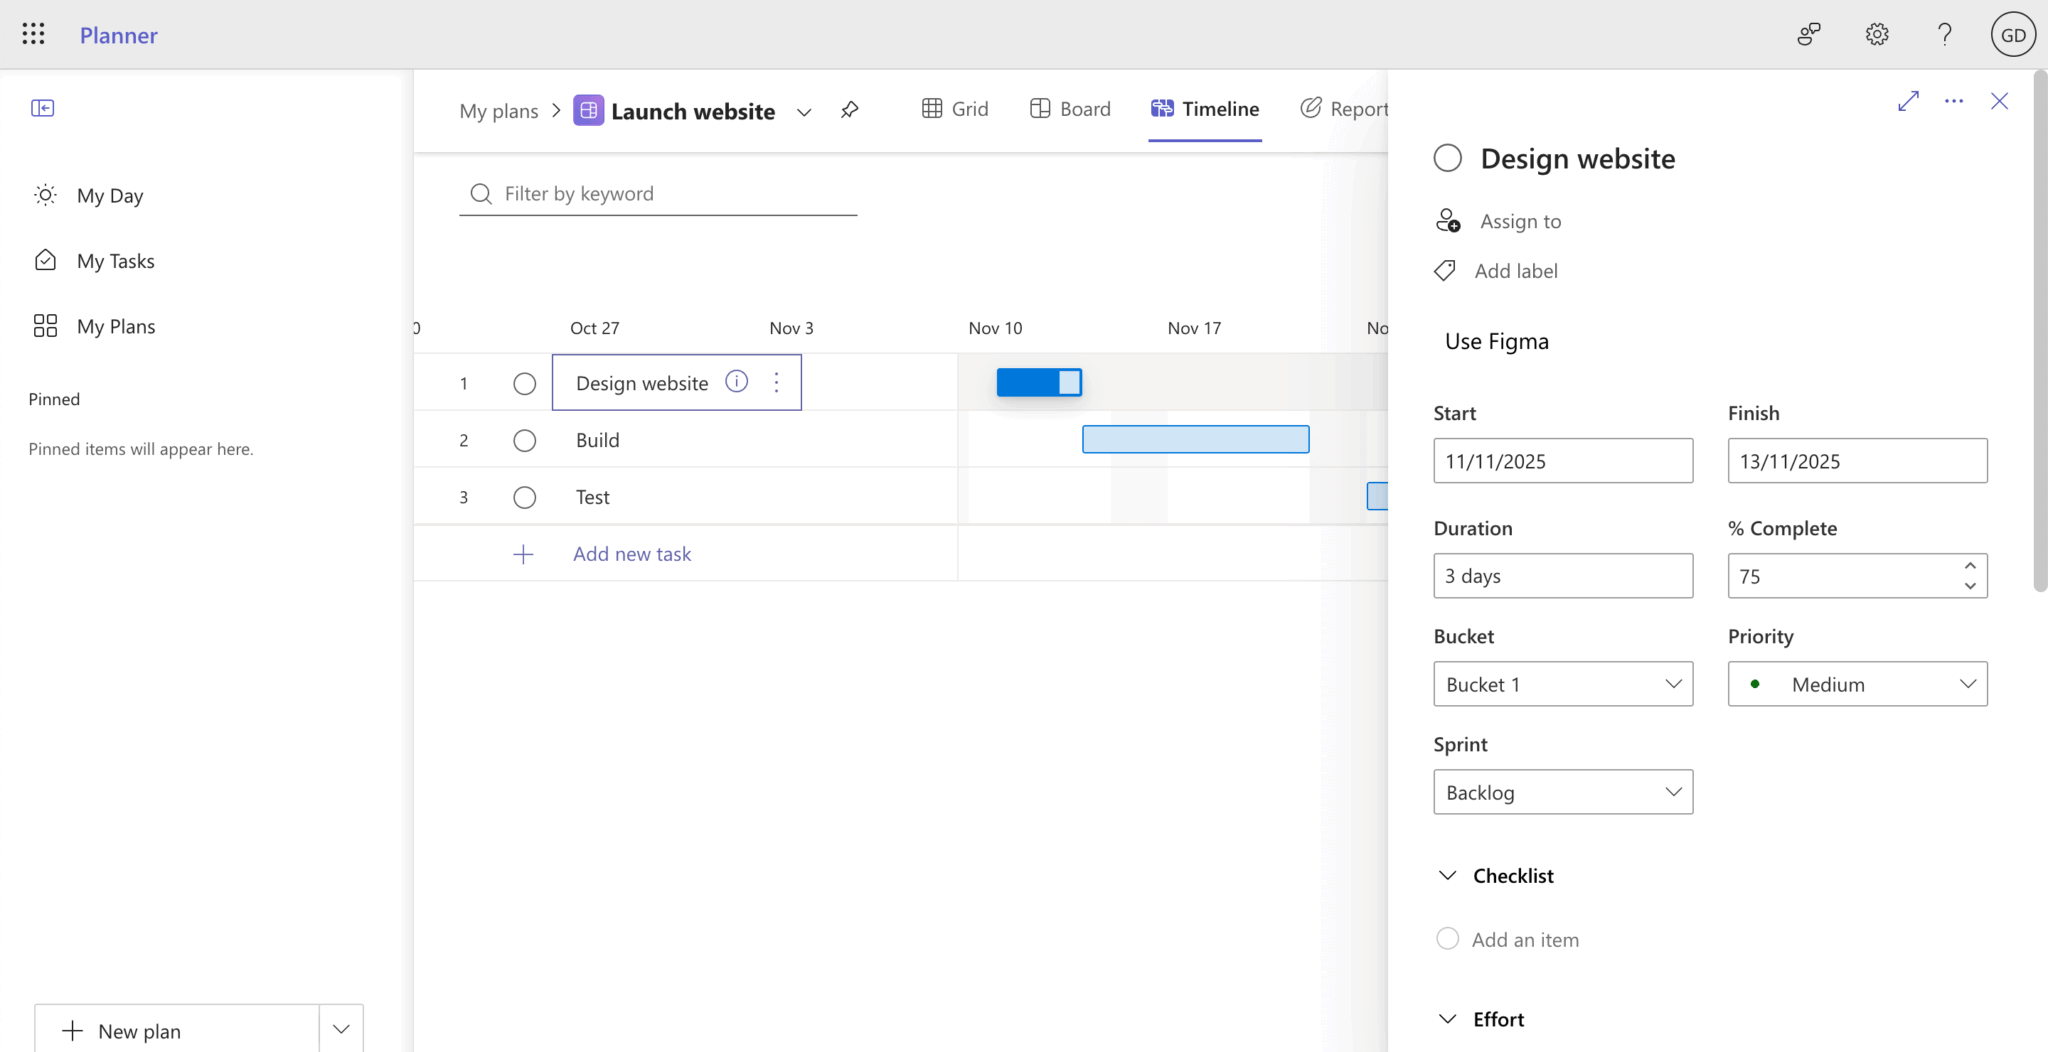
To create a task, click the + Add new task button in the left column of the Gantt chart. Name the task, then hover your cursor over (or focus on) the task name, and click the i button (also known as the “Open details” button) to the right of the task name to open the task details. Add a Start and Finish date, a % Complete value, a Priority, and a note.
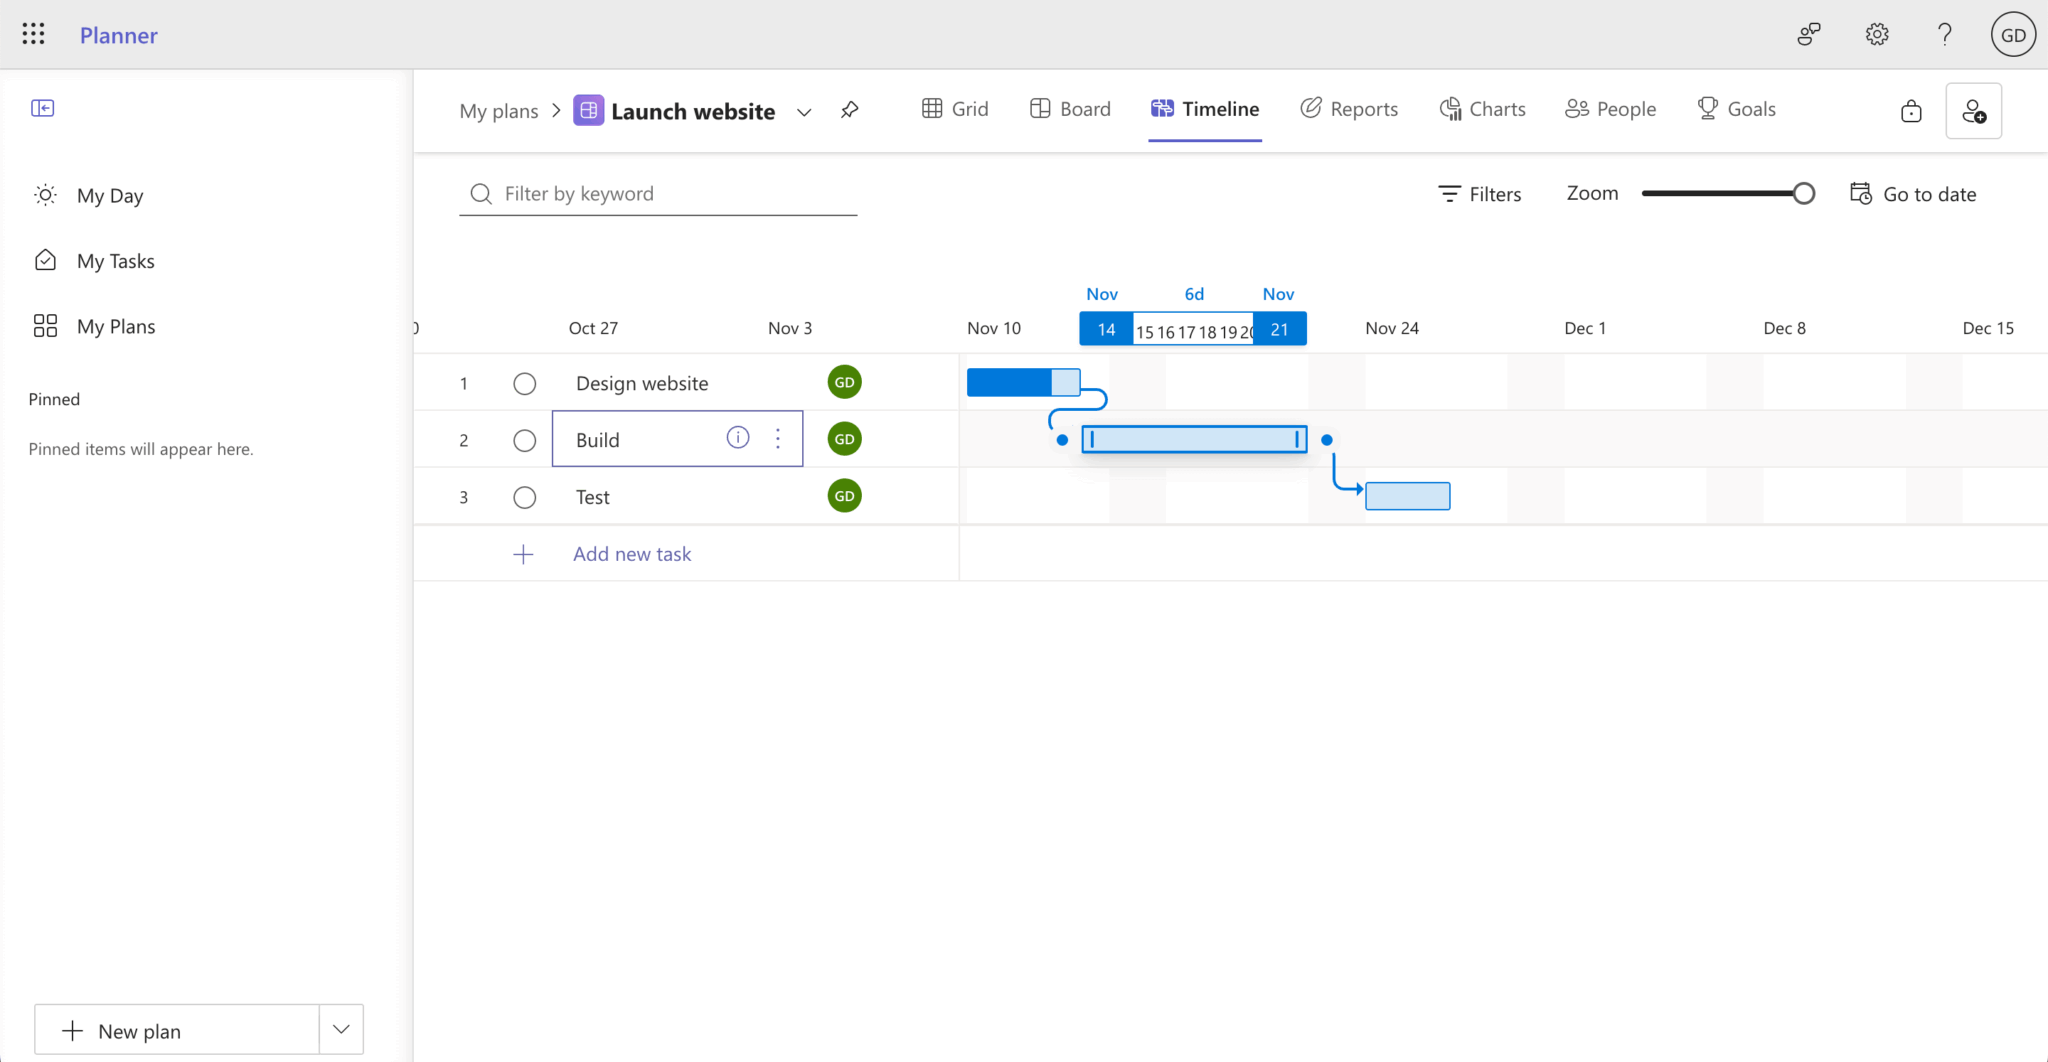
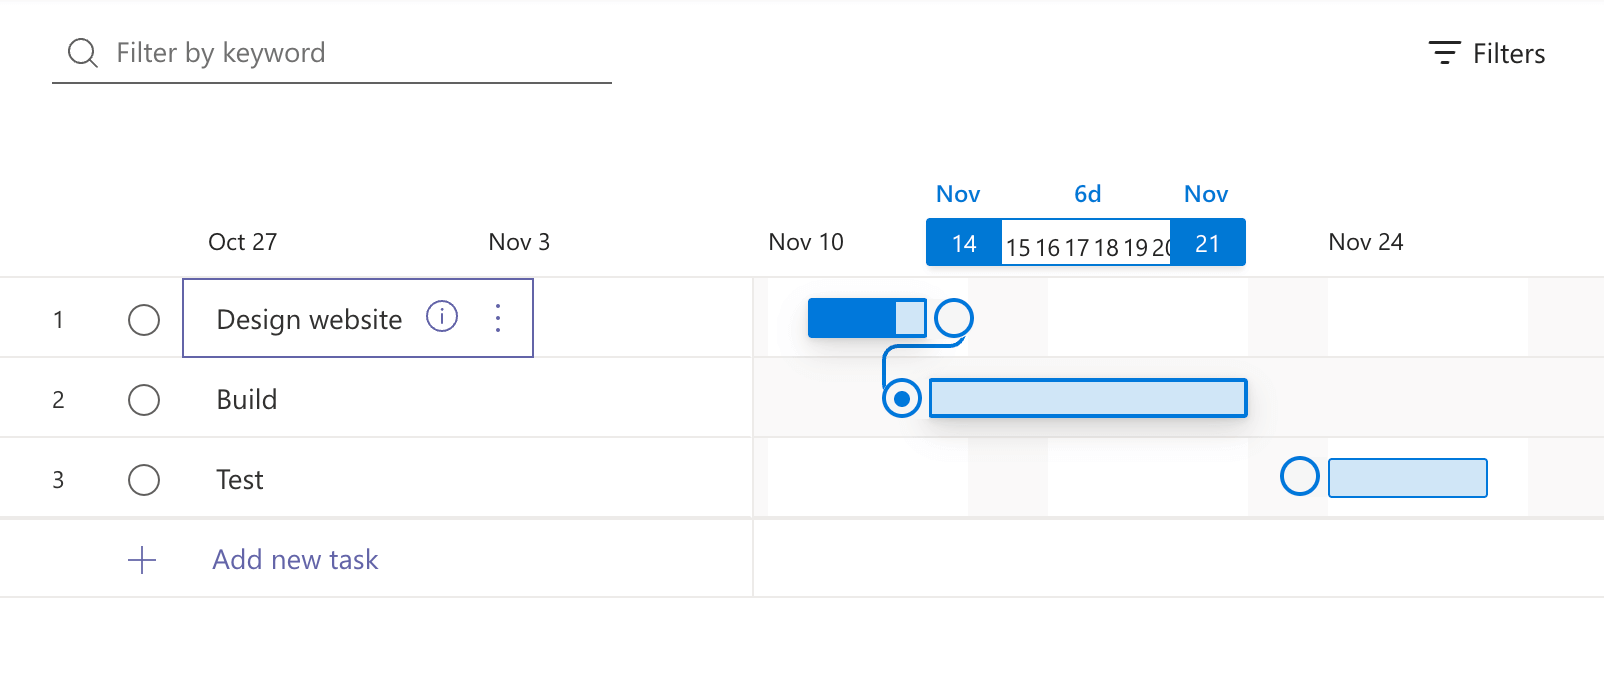
Create a dependency between some tasks by hovering your cursor over a task bar, and clicking and dragging the white circle on the side of the task bar until it connects to another task.
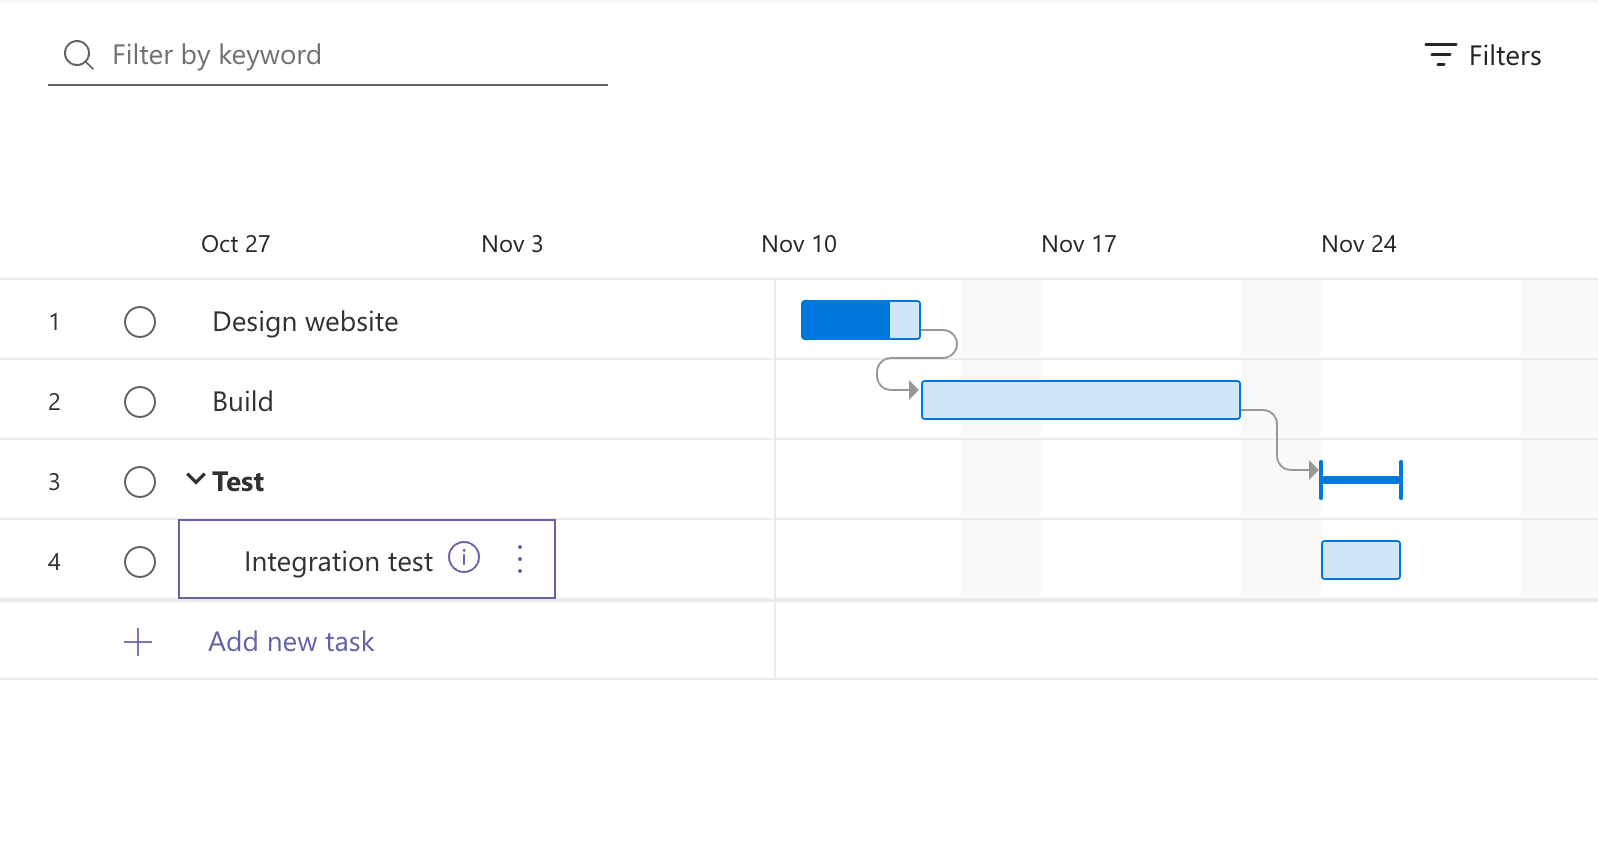
Make at least one task a subtask by hovering your cursor over (or focusing on) a task name, and clicking the : button (also known as the “More options” button) to the right of the task name to open the more options menu. Select Make subtask to indent the task.

You’ll now see a subtask in the Gantt chart:
Exporting the Microsoft Planner plan data to an Excel file
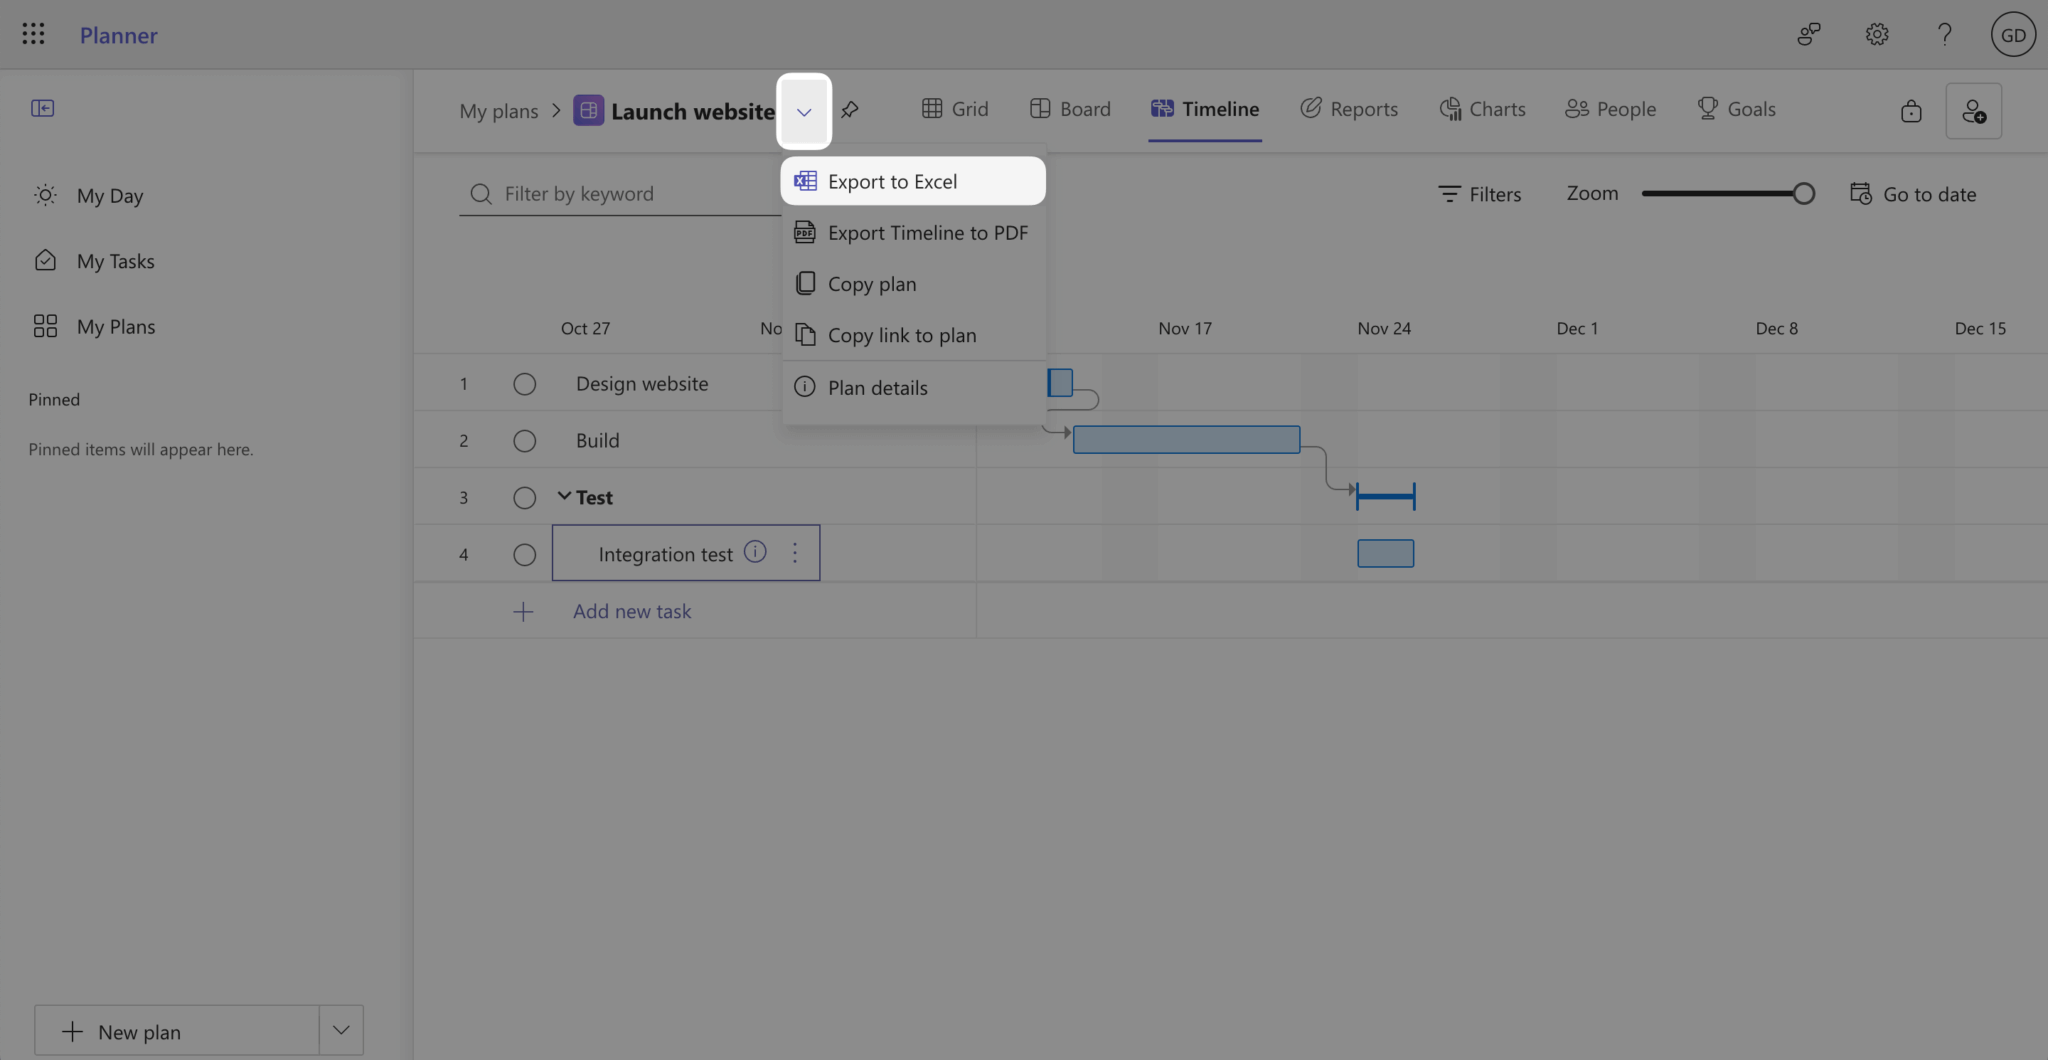
To export the plan data to an Excel file, click the More actions dropdown button to the right of the plan name and select Export to Excel:
You’ll see your plan data in the rows of the Excel file:
Converting the Excel data to Bryntum Gantt-compatible JSON
You can find the completed migration script for converting the Excel data to Bryntum Gantt-compatible JSON in our GitHub repository.
To create the script yourself, create a project folder and initialize it with the following command:
npm init -y
npm pkg set type=module
Then, add your downloaded Microsoft Project Excel file, for example, launch-website.xlsx, to the project folder.
Install the following dependency:
npm install xlsxThis installs the SheetJS library, which we’ll use to read the Excel file and convert the data to JSON format.
Creating a script to convert Excel file data to a JavaScript object
Create a migration-ms-project-bryntum-gantt.js file and add the following imports to it:
import fs from "fs";
import path from "path";
import { fileURLToPath } from "url";
import { dirname } from "path";
import xlsx from "xlsx";
Add the following constants to define the Excel file path and project name:
const excelfilePath = "./launch-website.xlsx";
const projectName = "Launch website";
Then, add the following lines of code to read the Excel file:
const workbook = xlsx.readFile(excelfilePath);
const sheetName = workbook.SheetNames[0];
const worksheet = workbook.Sheets[sheetName];

const jsonData = xlsx.utils.sheet_to_json(worksheet);
The readFile method reads the data from the Excel file and parses it into a workbook object. We get the first sheet from the workbook using workbook.SheetNames[0], then convert the worksheet to a JavaScript object using the sheet_to_json utility method.
⚠️ If you’re using your own Excel file, replace the values with your Excel file name and the project name in your Excel file. The project name is used to find the outline numbers of the tasks in the Excel file. You may need to adjust your Excel file to match this format or adjust the migration script code for your Excel file format.
Converting the JavaScript object to Bryntum Gantt-compatible JSON
We’ll use the Bryntum Gantt Crud Manager to fetch and update data using SharePoint REST APIs. The Crud Manager expects the data to have a specific structure.
Add the following line of code to the migration-ms-project-bryntum-gantt.js file to convert the JSON data to a Bryntum Gantt-compatible tree data structure:
const { tree: tasksRows, rawDependencies, taskMap } = createBryntumTasksRows(jsonData);The createBryntumTasksRows function (which we’ll define later) will return a tree data structure of tasks and their parent-child relationships.
Next, we’ll convert the raw dependency data from Microsoft Project format to Bryntum’s dependency format. Add the following lines of code to the bottom of the migration-ms-project-bryntum-gantt.js file:
const dependenciesRows = [];
let dependencyId = 0;

for (const rawDep of rawDependencies) {
  for (const dep of rawDep.dependencies) {
    const fromTask = taskMap[dep.outlineNumber];
    const toTask = taskMap[rawDep.outlineNumber];

    if (fromTask && toTask) {
      dependenciesRows.push({
        id: dependencyId++,
        fromTask: fromTask.id,
        toTask: toTask.id,
        type: mapDependencyType(dep.type)
      });
    }
  }
}
We loop through each task’s dependencies and create a dependency object for each dependency. The fromTask is the task that the dependency originates from. The toTask is the task the dependency points to. The type is the dependency type mapped from Microsoft Project format to Bryntum Gantt format.
Add the following lines of code to the bottom of the file to construct the correct JSON structure for the Bryntum Gantt Crud Manager:
// Convert JSON data to the expected load response structure
const ganttLoadResponse = {
  success: true,
  tasks: {
    rows: tasksRows,
  },
  dependencies: {
    rows: dependenciesRows,
  },
};

let dataJson = JSON.stringify(ganttLoadResponse, null, 2); // Convert the data to JSON, indented with 2 spaces
Creating the helper functions
Now let’s create the helper functions needed for the conversion.
Add the following function to the top of the file:
function convertToDate(excelDate) {
  // Convert Excel serial date to JavaScript Date
  // Excel dates are days since 1/1/1900
  const excelEpoch = new Date(1899, 11, 30);
  const jsDate = new Date(excelEpoch.getTime() + excelDate * 86400000);
  // Return date in YYYY-MM-DD format without time
  return jsDate.toISOString().split('T')[0];
}
Excel stores dates as a number format, with the number representing the offset from an epoch. They are stored as the number of days since 1/1/1900. In the above code, we create the epoch date, add the Excel date value (converted to milliseconds), and return the date in ISO format without the time component.
Add the following function to the top of the file:
function parseDuration(durationStr) {
  if (!durationStr || typeof durationStr !== 'string') return 0;
  const match = durationStr.match(/(\d+)\s*(day|days)/i);
  return match ? parseInt(match[1]) : 0;
}
This function uses a regular expression to extract the numeric value from duration strings like “3 days” or “2 days”.
Add the following function to the top of the file:
function calculateDuration(startDate, endDate) {
  // Calculate duration in days from start to end date
  // Bryntum duration is the number of days to ADD to start date to get end date
  // So for Nov 11 to Nov 13, duration should be 2 (11 + 2 = 13)
  if (!startDate || !endDate) return 0;

  const start = new Date(startDate);
  const end = new Date(endDate);

  // Set both to start of day for accurate day counting
  start.setHours(0, 0, 0, 0);
  end.setHours(0, 0, 0, 0);

  // Calculate difference in milliseconds and convert to days
  const diffTime = end - start;
  const diffDays = diffTime / (1000 * 60 * 60 * 24);

  return diffDays;
}
This function calculates the correct duration for Bryntum Gantt. Bryntum’s duration represents the number of days that need to be added to the start date to reach the end date. For example, a task that runs from the 11th to the 13th of November has a duration of 2 (11 + 2 = 13).
Now add the following function to the top of the file:
function parseDependencyString(depString) {
  // Parse dependency strings like "1FS", "2SS", "3FF,4SF" etc.
  // Returns array of {outlineNumber, type}
  if (!depString) return [];

  const deps = depString.toString().split(',').map(d => d.trim()).filter(d => d);
  return deps.map(dep => {
    // Extract outline number and dependency type (e.g., "1FS" -> {outlineNumber: "1", type: "FS"})
    const match = dep.match(/^([\d.]+)([A-Z]{2})$/);
    if (match) {
      return {
        outlineNumber: match[1],
        type: match[2]
      };
    }
    return null;
  }).filter(d => d !== null);
}
This function parses dependency strings from Microsoft Project, which stores dependencies as strings like “1FS”, “4SS”, or “3FF” (where the number is the task’s outline number and the letters indicate the dependency type), and returns an array of dependency objects.
Now add the following function to the top of the file:
function mapDependencyType(msProjectType) {
  // Map Microsoft Project dependency types to Bryntum
  const typeMap = {
    'FS': 2,
    'SS': 0,
    'FF': 3,
    'SF': 1
  };
  return typeMap[msProjectType] || 2; // Default to FS if unknown
}
This function maps between the Microsoft Project and Bryntum dependency type formats.
Microsoft Project uses the following letter codes for dependency types:
- FS: Finish-to-Start
- SS: Start-to-Start
- FF: Finish-to-Finish
- SF: Start-to-Finish
Bryntum uses numeric values for dependency types (0-3).
Now add the main function that processes the Excel data and creates Bryntum tasks to the top of the file:
function createBryntumTasksRows(data) {
  let taskId = 0;
  const tree = [];
  const taskMap = {}; // Map outline numbers to task objects
  const rawDependencies = []; // Store raw dependencies to process later

  // Start from index 8 where actual task data begins (after header row)
  for (let i = 8; i < data.length; i++) {
    const row = data[i];

    // Skip empty rows
    if (!row["__EMPTY"]) continue;

    const outlineNumber = row[projectName];
    const name = row["__EMPTY"];
    const assignedTo = row["__EMPTY_1"] || undefined;
    const startDate = row["__EMPTY_2"] ? convertToDate(row["__EMPTY_2"]) : undefined;
    const endDate = row["__EMPTY_3"] ? convertToDate(row["__EMPTY_3"]) : undefined;
    const duration = startDate && endDate ? calculateDuration(startDate, endDate) : parseDuration(row["__EMPTY_4"]);
    const bucket = row["__EMPTY_5"];
    const percentComplete = row["__EMPTY_6"] ? row["__EMPTY_6"] * 100 : 0;
    const priority = row["__EMPTY_7"];
    const dependsOn = row["__EMPTY_8"]; // Dependencies column
    const milestone = row["__EMPTY_13"] === "Yes";
    const notes = row["__EMPTY_14"];

    // Determine if this is a parent task (outline number has no decimal)
    const isParent = !outlineNumber.toString().includes(".");

    const task = {
      id: taskId,
      name,
      ...(startDate && { startDate }),
      ...(duration !== undefined && { duration }),
      ...(assignedTo && { resourceAssignment: assignedTo }),
      percentDone: percentComplete,
      ...(isParent && { expanded: true }),
      ...(milestone && { duration: 0 }),
      ...(notes && { note: notes }),
      ...(bucket && { bucket }),
      ...(priority && { priority }),
      children: []
    };

    // Store raw dependencies for later processing
    if (dependsOn) {
      const deps = parseDependencyString(dependsOn);
      if (deps.length > 0) {
        rawDependencies.push({
          taskId: taskId,
          outlineNumber: outlineNumber,
          dependencies: deps
        });
      }
    }

    // Add to tree or to parent's children
    if (isParent) {
      tree.push(task);
    } else {
      // Extract parent outline number (e.g., "2.1" -> "2")
      const parentOutline = outlineNumber.toString().split(".")[0];
      const parent = taskMap[parentOutline];
      if (parent) {
        parent.children.push(task);
      }
    }

    // Store mapping for children to find their parent
    taskMap[outlineNumber] = task;

    taskId++;
  }

  return { tree, rawDependencies, taskMap };
}
This function loops through the Excel data (starting from index 8, where the actual task data begins) and does the following:
- Extracts task data
- Converts dates
- Calculates durations
- Determines parent/child relationships
- Creates a tree structure where parent tasks contain their children in a
childrenarray - Returns the tree, raw dependencies, and a task map for easy lookup
Saving the data to a JSON file
Finally, we’ll save the converted data to a JSON file. Add the following lines of code to the bottom of the file:
const __filename = fileURLToPath(import.meta.url);
const __dirname = dirname(__filename);
const filePath = path.join(__dirname, "data.json");

// Write the JSON string to a file
fs.writeFile(filePath, dataJson, (err) => {
  if (err) throw err;
  console.log("JSON data written to data.json");
});
Here, we use the Node.js File System module to write the JSON string to a file called data.json in the same directory as the script.
Convert your Microsoft Project Excel file to Bryntum-compatible JSON by running the following command:
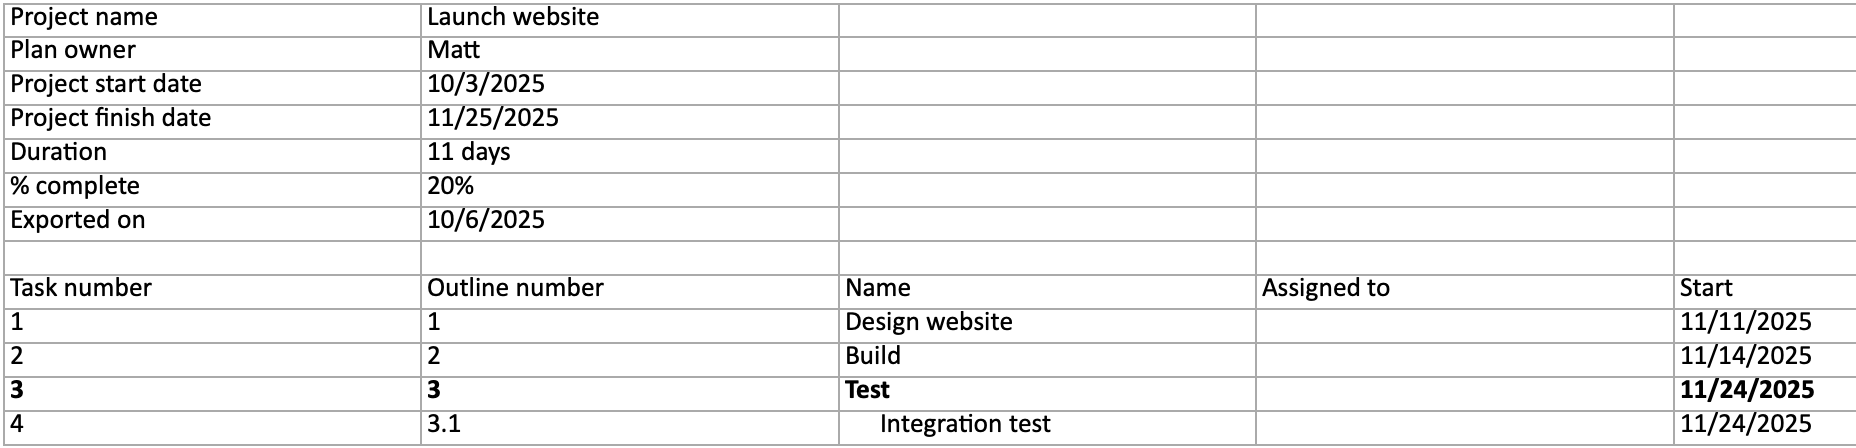
node migration-ms-project-bryntum-gantt.jsThis creates a data.json file with your tasks and dependencies in the format expected by Bryntum Gantt:
{
  "success": true,
  "tasks": {
    "rows": [
      {
        "id": 0,
        "name": "Design website",
        "startDate": "2025-11-11",
        "duration": 2,
        "percentDone": 75,
        "expanded": true,
        "note": "Use Figma",
        "bucket": "Bucket 1",
        "priority": "Medium",
        "children": []
      },
      {
        "id": 1,
        "name": "Build",
        "startDate": "2025-11-14",
        "duration": 7,
        "percentDone": 0,
        "expanded": true,
        "priority": "Medium",
        "children": [
          {
            "id": 2,
            "name": "Make web app",
          ...
Getting started with the Bryntum Gantt SharePoint demo app
The SharePoint Framework simplifies client-side SharePoint development, allowing you to build SharePoint apps using modern web technologies and tools in your development environment of choice.
We’ll use the SharePoint Fabric example app from the Bryntum Gantt distribution code as a starting point. The example app uses Office UI Fabric React components.
To download the Bryntum Gantt distribution code, download the free Bryntum Gantt trial. If you have a Bryntum Gantt license, you can download the Bryntum Gantt distribution code from the Bryntum Customer Zone.
When you’ve downloaded the Bryntum Gantt distribution code, navigate to the React TypeScript SharePoint-Fabric example folder and open it in your IDE:
cd examples/frameworks/react/typescript/sharepoint-fabricWe created this demo using a Yeoman plugin for the SharePoint Framework. The plugin is a generator that sets up a SharePoint client-side web part project. SharePoint client-side web parts are the building blocks of pages on a SharePoint site that can execute client-side code in the browser. You can build web parts with vanilla JavaScript or popular web frameworks like React, Angular, and Vue. The example project uses React and TypeScript.
This example project uses npm packages from the private Bryntum npm repository. To access these packages, you must log in to the repository as a licensed or trial user. If you don’t have repository access, follow our guide to accessing the npm repository.
⚠️ The SharePoint Framework version used in the example project requires you to use Node.js version 18.17.1.
Install the project dependencies:
npm iYou also need to install gulp as a global dependency for SharePoint Framework development:
npm install -g gulpGulp is a JavaScript toolkit for automating repetitive tasks. The SharePoint Framework build toolchain uses gulp tasks to build and deploy projects.
Now, we need to run the following gulp utility task:
gulp trust-dev-certThe SharePoint Framework local web server that we’ll use to test the SharePoint Bryntum Gantt app uses HTTPS by default. Your development environment won’t trust the self-signed certificate issued to implement the test, so the gulp utility task configures your development environment to trust the certificate. Every SharePoint Framework project includes this utility task.
Running a development web server to test the app
You can test client-side SharePoint web parts locally using the SharePoint Workbench, which includes a client-side page and canvas where you can add, delete, and test your SharePoint web parts.
To run the local development server, use the serve gulp task (configured in serve.json), which launches the Workbench URL in a browser window.
First, you need to update the default URL to include the domain of your SharePoint tenant site. In the config folder, update the "initialPage" property in the serve.json file with the following, replacing <your-sharepoint-tenant-id> with your tenant ID (which you get when you set up a Microsoft 365 tenant):
"initialPage": "https://<your-sharepoint-tenant-id>.sharepoint.com/_layouts/workbench.aspx"Then, run the gulp task with the following command:
npm run startIn the SharePoint Workbench browser window that opens, click on the + icon to add the Bryntum Gantt as a web part of the workbench. A toolbox will open, listing the web parts available for you to add. Click on the BryntumGantt web part that is locally available.
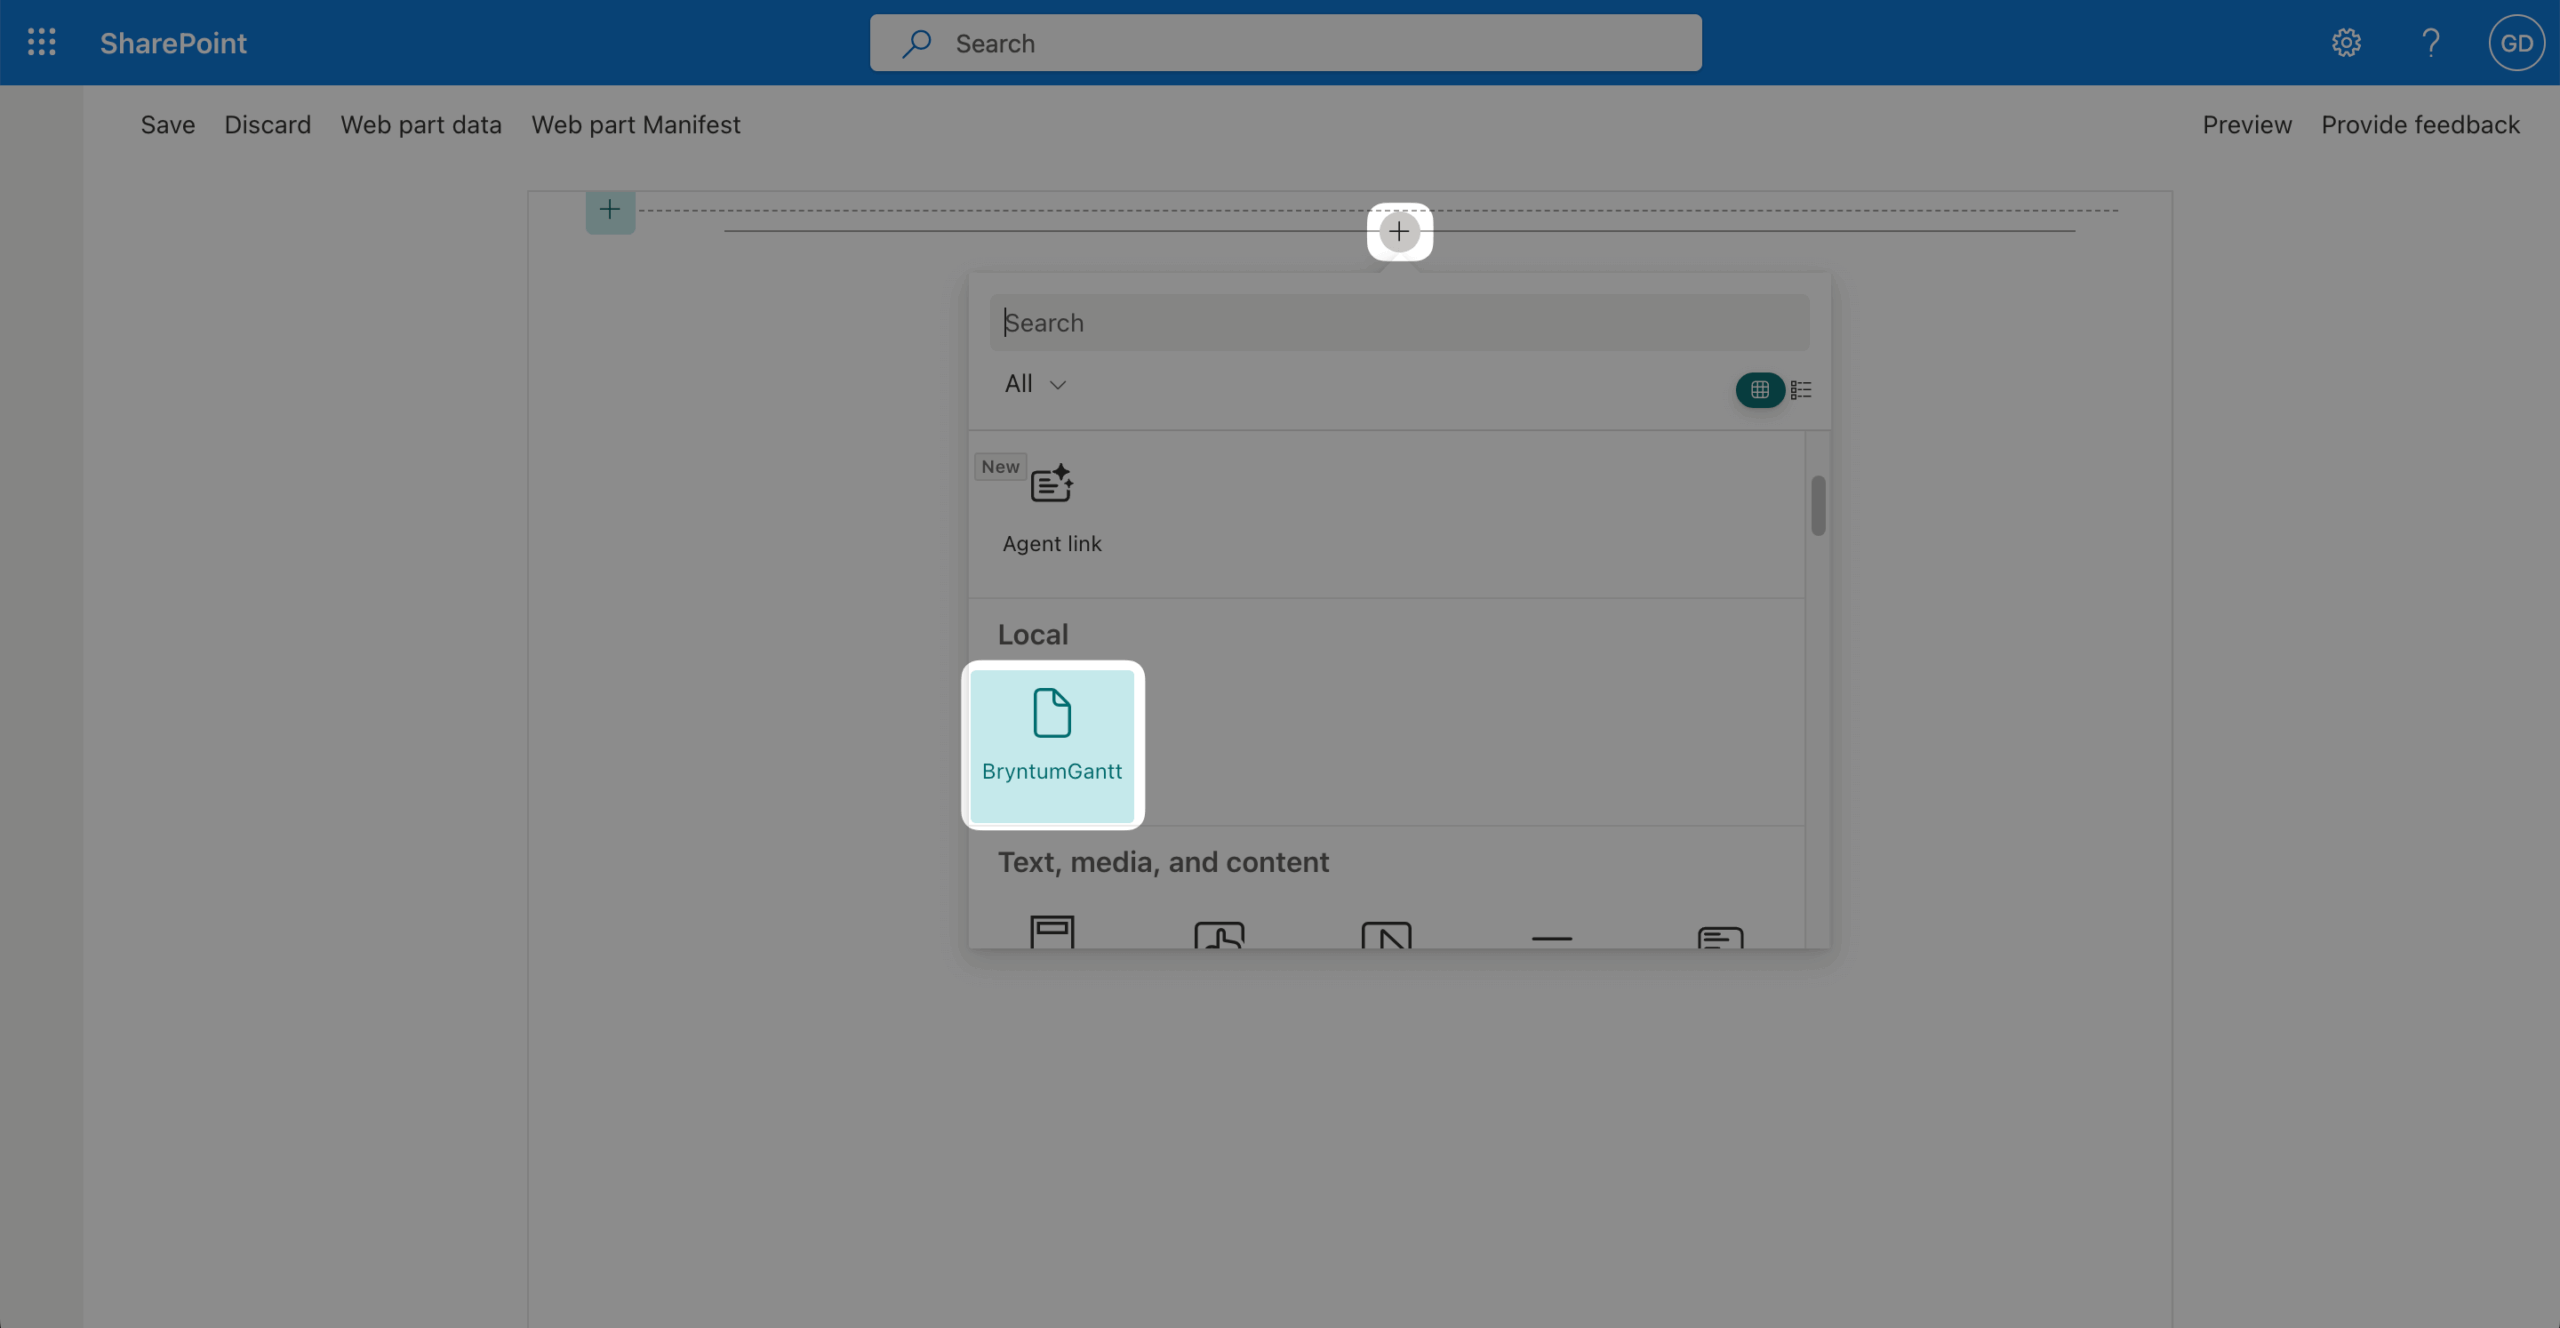
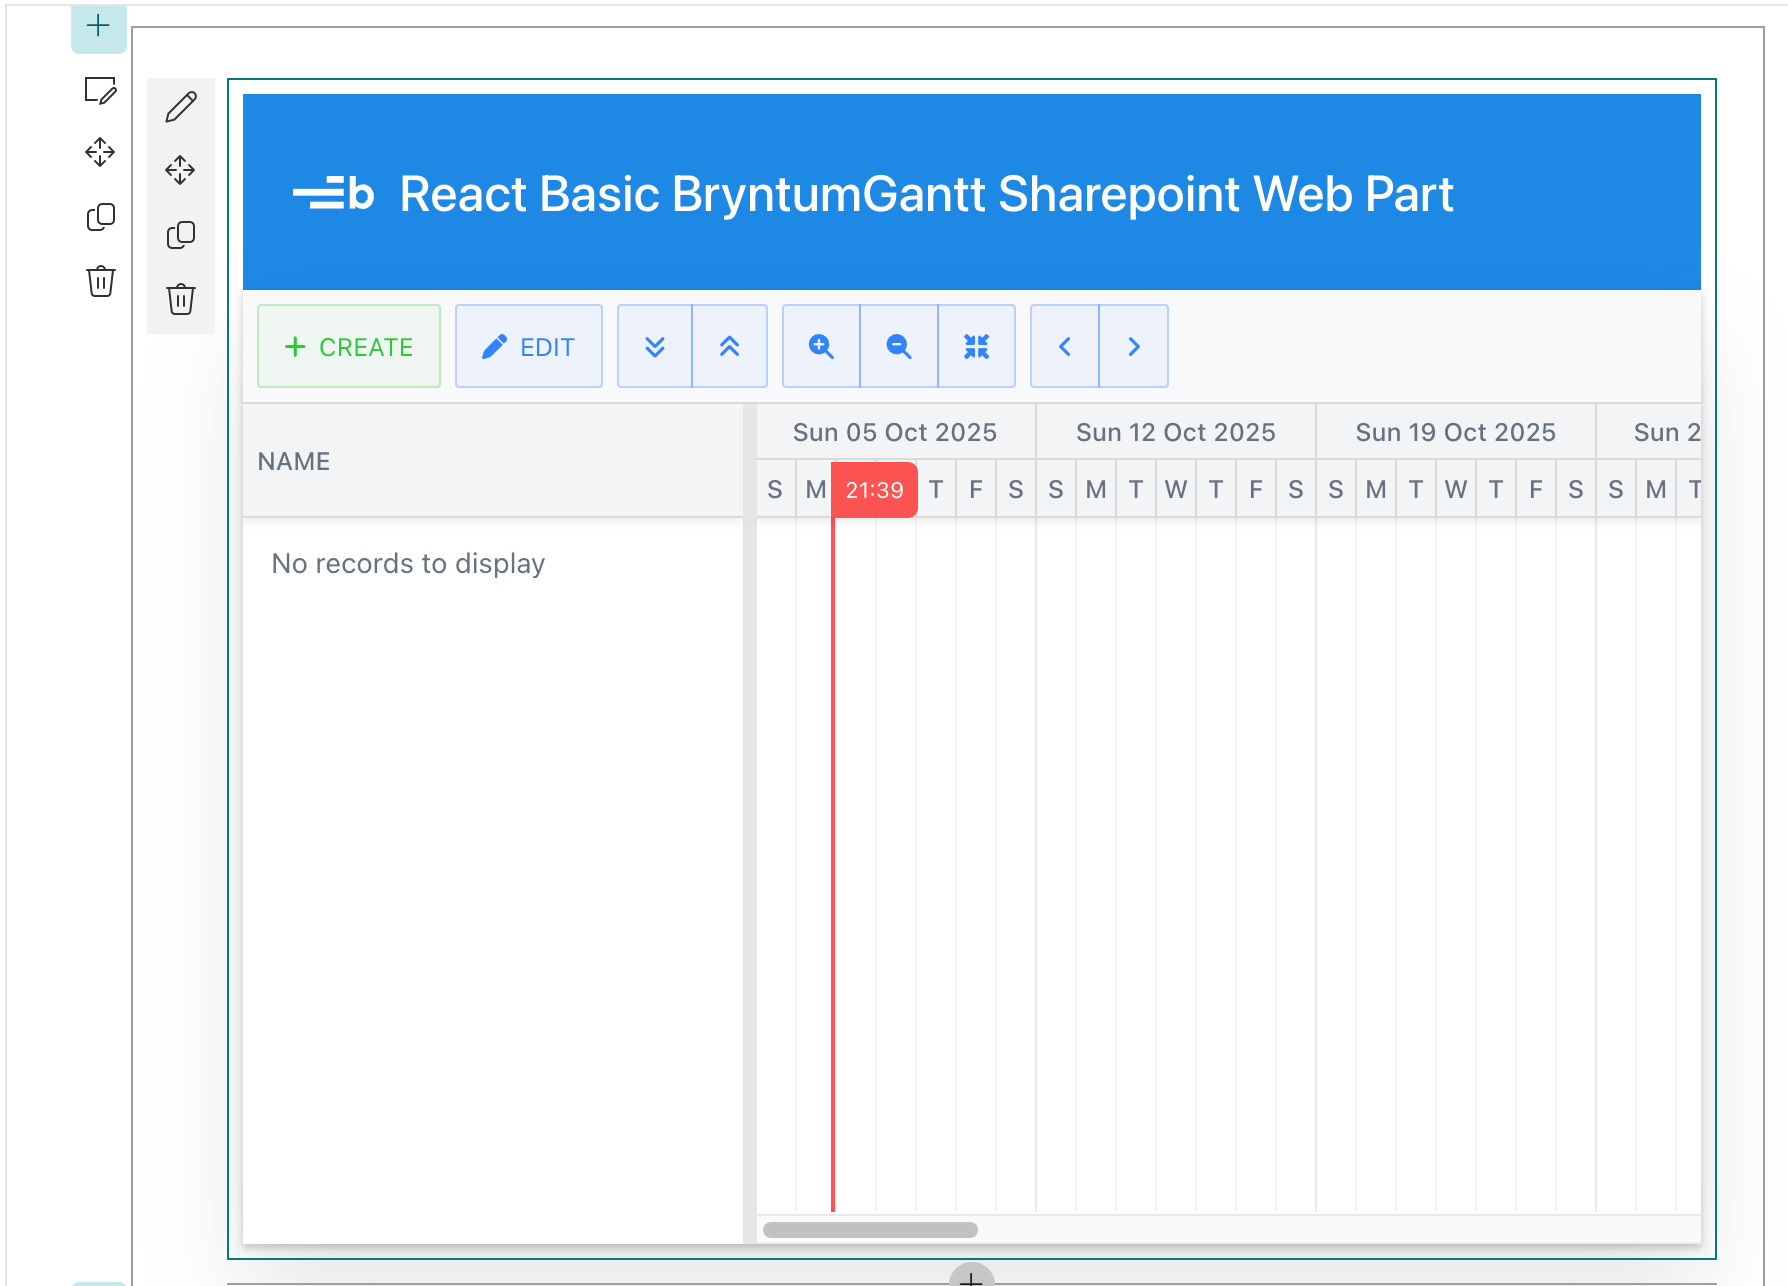
You’ve now added the Bryntum Gantt client-side web part to the client-side page. You’ll get an alert warning saying, Please create a task list.
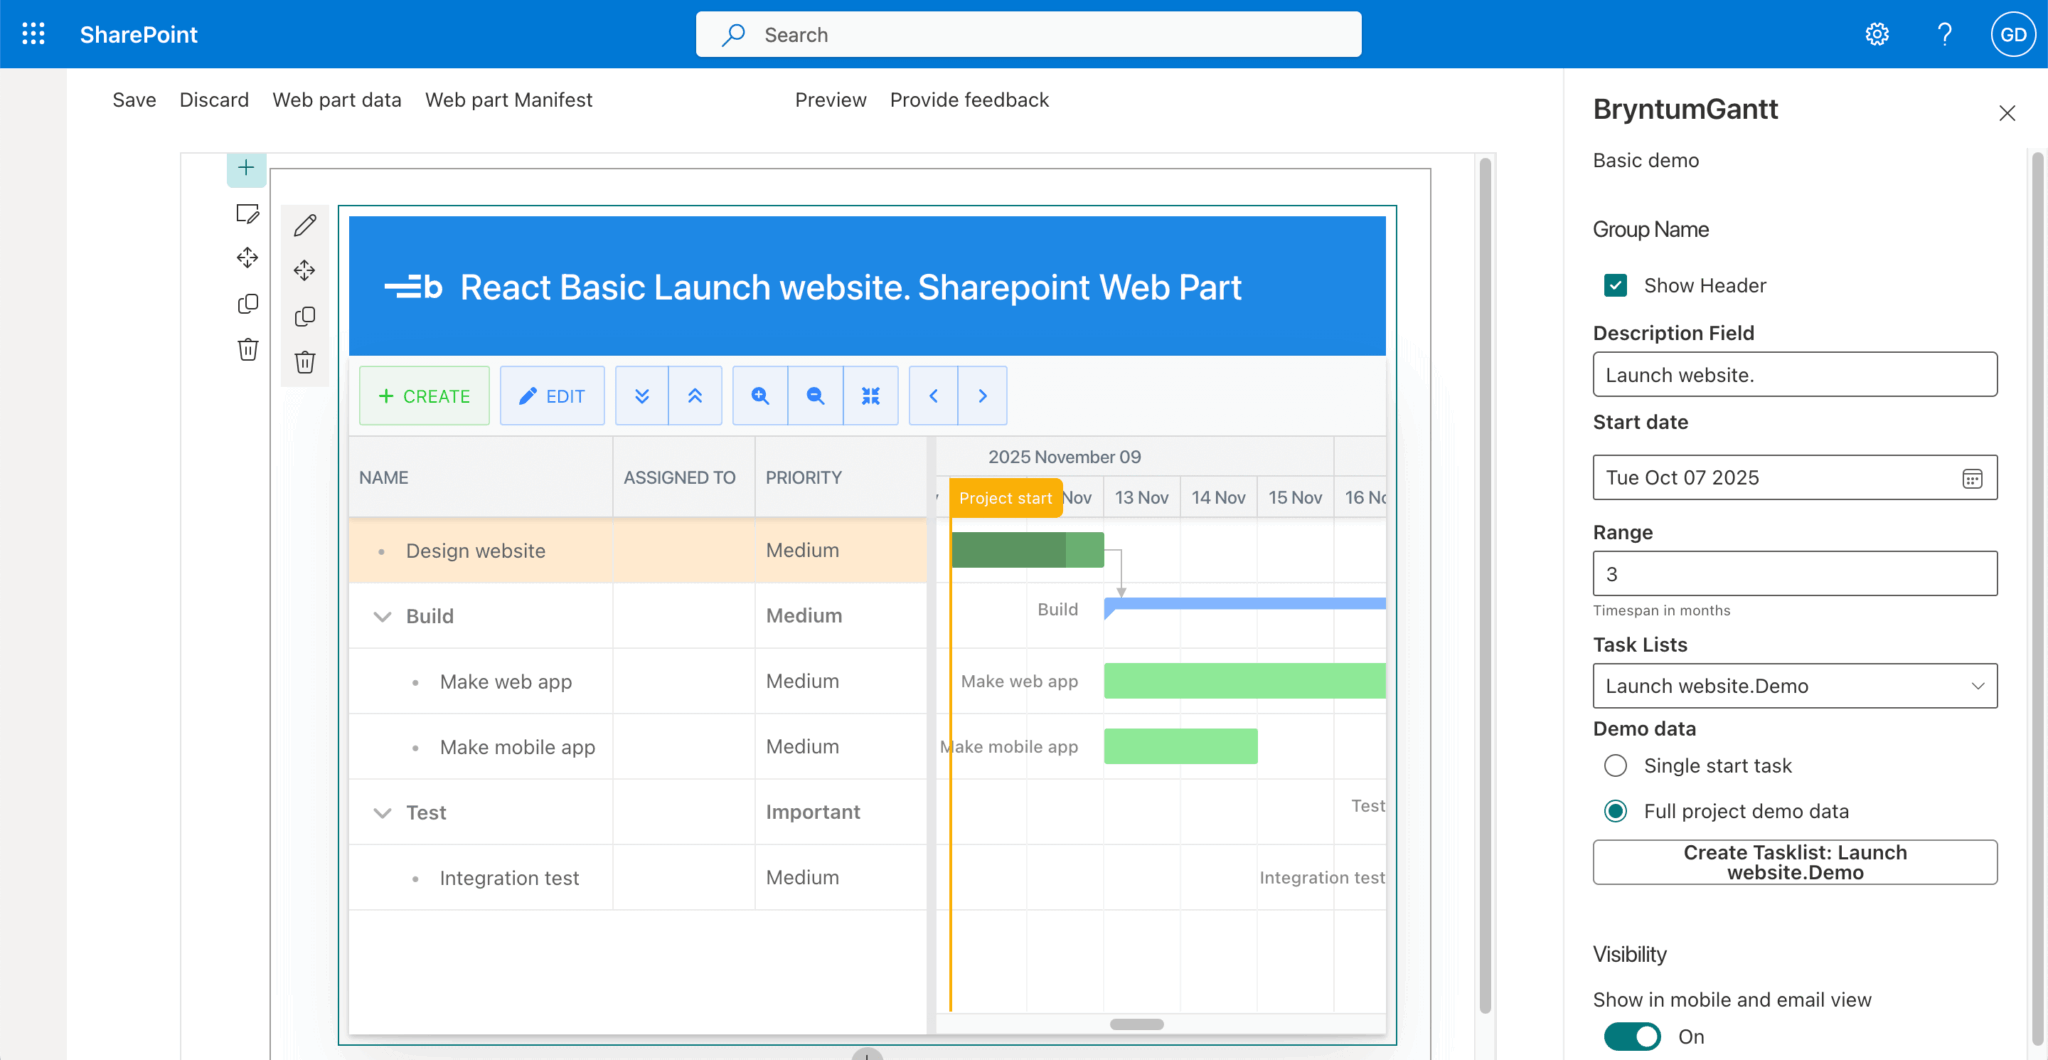
The Bryntum Gantt SharePoint web part has some initial demo data. To add data to your Bryntum Gantt SharePoint web part, click the pencil icon in the top-left corner of the web part. In the web part property pane that opens, select the Full project demo data radio button and click Create Tasklist: BryntumGanttDemo.
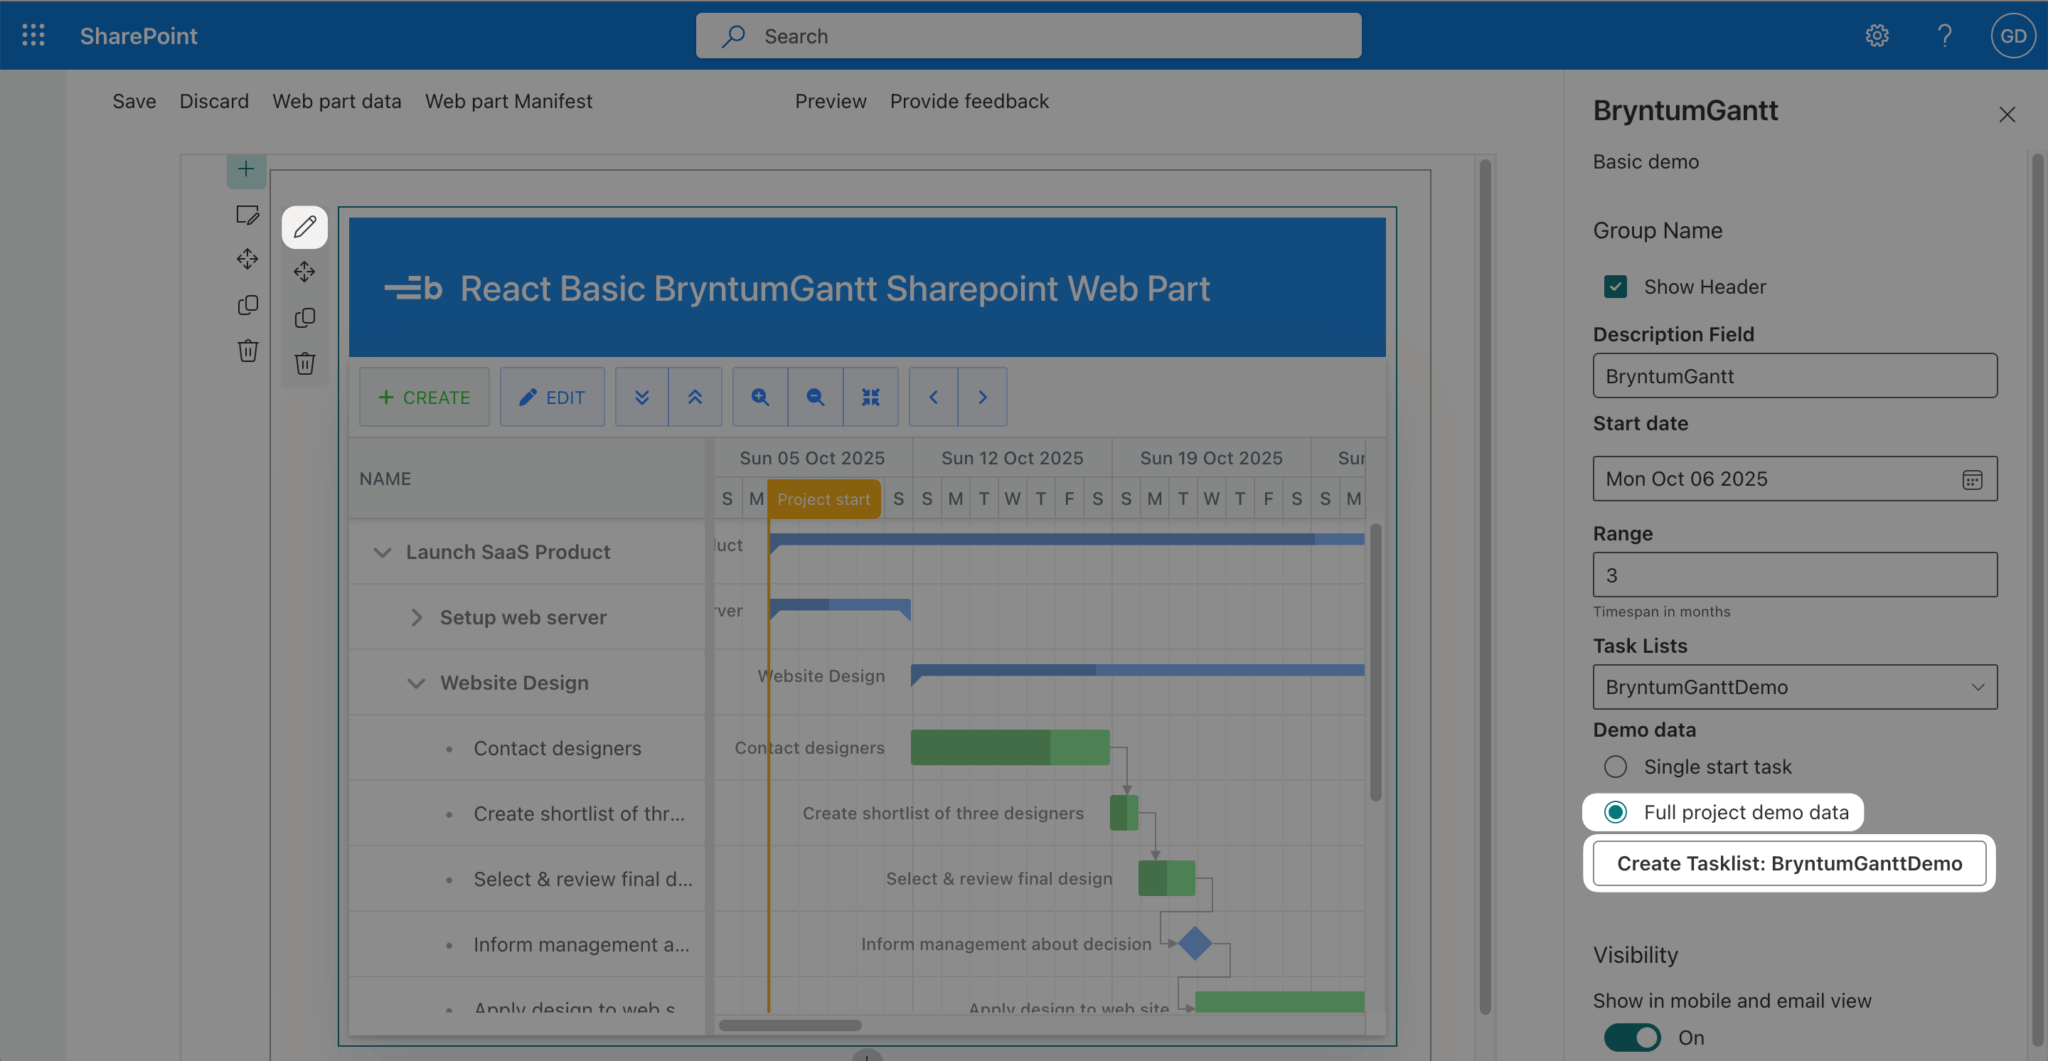
This creates a task list from the tasks data in the launch-saas.json file in the src/webparts/bryntumGantt/resources/data folder. The task list is a SharePoint list, a collection of data displayed in rows and columns. We’ll use this list to store the Bryntum Gantt SharePoint web part data.
The web part property pane is configured in the getPropertyPaneConfiguration method of the BryntumGanttWebPart class. You can find this class in the src/webparts/bryntumGantt/BryntumGanttWebPart.ts file.
The tasks data in the launch-saas.json file is used to create a SharePoint list in the DemoData.ts file in the src/webparts/bryntumGantt/data/service folder. This file exports a DemoData class that has a createFullExample method.
The Service.ts file in the src/webparts/bryntumGantt/data/service folder exports a class called Service. It has a public ensureList method that’s used to create a SharePoint task list in the createFullExample method. The Service class is one of the props passed in to the React App in the webparts/bryntumGantt/components/App.tsx file. It’s then passed in to the Gantt component.
The Bryntum Gantt ProjectModel is configured to load data from and sync data to a SharePoint list using the Bryntum Crud Manager. The modified ProjectModel is named TaskListModel. It’s in the TaskListModel.ts file in the src/webparts/bryntumGantt/data/model folder. The TaskListModel loads and syncs data using the Service class.
The Bryntum Gantt SharePoint web part overwrites the default Ajax requests used by the Bryntum Crud Manager (when data is loaded into the Bryntum Gantt or there’s a sync request after data is changed) and uses custom load and sync methods instead. These custom methods get and update list data using PnPjs libraries to make SharePoint REST API requests. You can see the custom load and sync methods in the BaseService.ts file in the src/webparts/bryntumGantt/data/service folder.
To learn how the Bryntum Gantt uses the SharePoint list as a data source, read the guide in the guide/guide.md file.
Using your own Gantt chart JSON data
In the launch-saas.json file in the src/webparts/bryntumGantt/resources/data folder, replace the JSON object with the JSON object in the data.json file that you created from your Microsoft Project Excel file in the previous section.
Now we can add columns to the Gantt chart. In the src/webparts/bryntumGantt/components/Gantt/GanttProps.tsx file, change the columns for the Gantt chart:
columns : [
    { type : 'name', field : 'name', width : 250 },
    {
      type: "resourceassignment",
      text: "Assigned to",
      showAvatars: false,
      width: 100,
    },
    {
      text   : 'Priority',
      field  : 'priority',
      width  : 120,
      editor : {
          type       : 'combo',
          editable   : false,
          autoExpand : true,
          items      : [
              ['urgent', 'Urgent'],
              ['important', 'Important'],
              ['medium', 'Medium'],
              ['low', 'Low']
          ]
      },
    },
],
You can learn more about configuring Gantt chart columns in the Bryntum Gantt tutorial.
To include task fields that aren’t in the default SharePoint task list, we can update the TaskModel.ts file in the src/webparts/bryntumGantt/data/model folder. Add the following objects to the array returned from the additionalFields method:
{ name : 'bucket', dataSource : 'Bucket' },
{ name : 'priority', dataSource : 'Priority' }
Modifying the DemoData.ts file
In the src/webparts/bryntumGantt/data/service/DemoData.ts file, we need to make some changes to the createFullExample method.
First, we’ll remove the date adjustment logic. The original code adjusted all task dates relative to the current date. We’ll remove this so that dates from your JSON file are used exactly as specified:
Remove the following from the src/webparts/bryntumGantt/data/service/DemoData.ts file:
// Remove these lines (around line 33):
const firstTask = tasks[0];
const diff = DateHelper.diff(DateHelper.parse(firstTask.startDate, DateHelper.defaultFormat), new Date(), 'days');
Remove the oldStartDate and newStartDate variables and replace them with the following:
const newStartDate = DateHelper.parse(child.startDate, DateHelper.defaultFormat);Change the newEndDate variable in the if block to the following:
newEndDate = DateHelper.parse(child.endDate, DateHelper.defaultFormat);Update the data variable in the createFullExample method to include the Bucket and Priority fields:
const data = {
    Title           : child.name,
    StartDate       : newStartDate,
    DueDate         : newEndDate,
    PercentComplete : percentComplete,
    Bucket          : child.bucket,
    Priority        : child.priority
};
Now fix the predecessor handling to prevent null values from being sent to SharePoint. Remove the following if statement:
// Change from:
if (dependency.length > 0) {
    data['PredecessorsId'] = dependency.map(item => generatedIdMap[item.fromTask]);
}
Replace it with the following if statement:
if (dependency.length > 0) {
    const predecessorIds = dependency.map(item => generatedIdMap[item.fromTask]).filter(id => id !== undefined);
    if (predecessorIds.length > 0) {
        data['PredecessorsId'] = predecessorIds;
    }
}
This prevents SharePoint API errors from occurring when dependencies reference tasks that haven’t been created yet.
The createFullExample method has a recursive, async iterateTasks function that loops through all of the tasks from the launch-saas.json file and creates JavaScript Date objects for each task’s start and end dates. If a task has no end date, the function creates one, as required by the SharePoint list.
The addTaskListItems method then creates the SharePoint list one task at a time. We’ve added the Bucket and Priority fields to the data object. Note that the SharePoint list field names start with a capital letter.
Now we’ll change the description of the SharePoint Bryntum Gantt web part. Open the BryntumGanttWebPart.manifest.json file in the src/webparts/bryntumGantt folder. In the "preconfiguredEntries" property, find the "properties" property and change the "description" property to "Launch website".
Now delete the lib folder and run the gulp serve task again:
npm run startAdd the data as we previously did with the example data, but change the Description field in the web part property pane to prevent caching issues. You may need to wait and refresh the page for the new task list to show, or delete and add the Gantt Chart SharePoint web part again.
You should now see your Bryntum Gantt SharePoint web part in the SharePoint workbench:
Notice that the Assigned to column doesn’t show any values from your JSON data. To assign SharePoint team members, double-click on a cell and select team members.
⚠️ If you make changes to the code, you need to increment the version number in config/package-solution.json, run gulp bundle --ship and gulp package-solution --ship, and deploy the web part again.
Now let’s deploy this Bryntum Gantt SharePoint web part to a SharePoint page.
Packaging your Bryntum Gantt client-side web part for deployment
First, stop the gulp serve task if it’s still running.
To add a client-side web part to a SharePoint page, you need to deploy and register the web part with SharePoint. The first step is to package the web part, which you can do by running the following commands in the project root directory:
gulp bundle --ship
gulp package-solution --ship
The gulp bundle command bundles your client-side Bryntum Gantt web part. The --ship flag adds the JavaScript, CSS, and other assets to the bundled package.
The package-solution.json file in the config folder defines the package metadata. The gulp package-solution command creates the web part package, bryntum-gantt.sppkg, which you can find in the ./sharepoint/solution folder.
You can view the raw package contents in the ./sharepoint/solution/debug folder. The .sppkg file uses Microsoft Open Packaging Conventions to package your solution. The package format is similar to the SharePoint add-in package format.
Deploying your Bryntum Gantt package to the SharePoint app catalog
Deploy your Bryntum Gantt package to your SharePoint app catalog as follows:
- Go to More features in the SharePoint admin center and sign in with an account that has admin permissions for your organization.
- Under Apps, select Open.
- On the Manage apps page, select Upload to upload your
bryntum-gantt.sppkgfile. - In the Enable app panel, select Only enable this app, then click the Enable app button.
Now go to your SharePoint tenant site and create a team site if you don’t have one already. Install the Bryntum Gantt app on your team site. Next, create a page if your team site does not have one, and add your Bryntum Gantt app web part to your page. Add the demo data as you did when developing locally in SharePoint workbench.
Click Publish in the top-right corner of the page. You can copy the page address and share it with your Microsoft SharePoint team members.
On the deployed site, you’ll see the Bryntum Gantt web part:
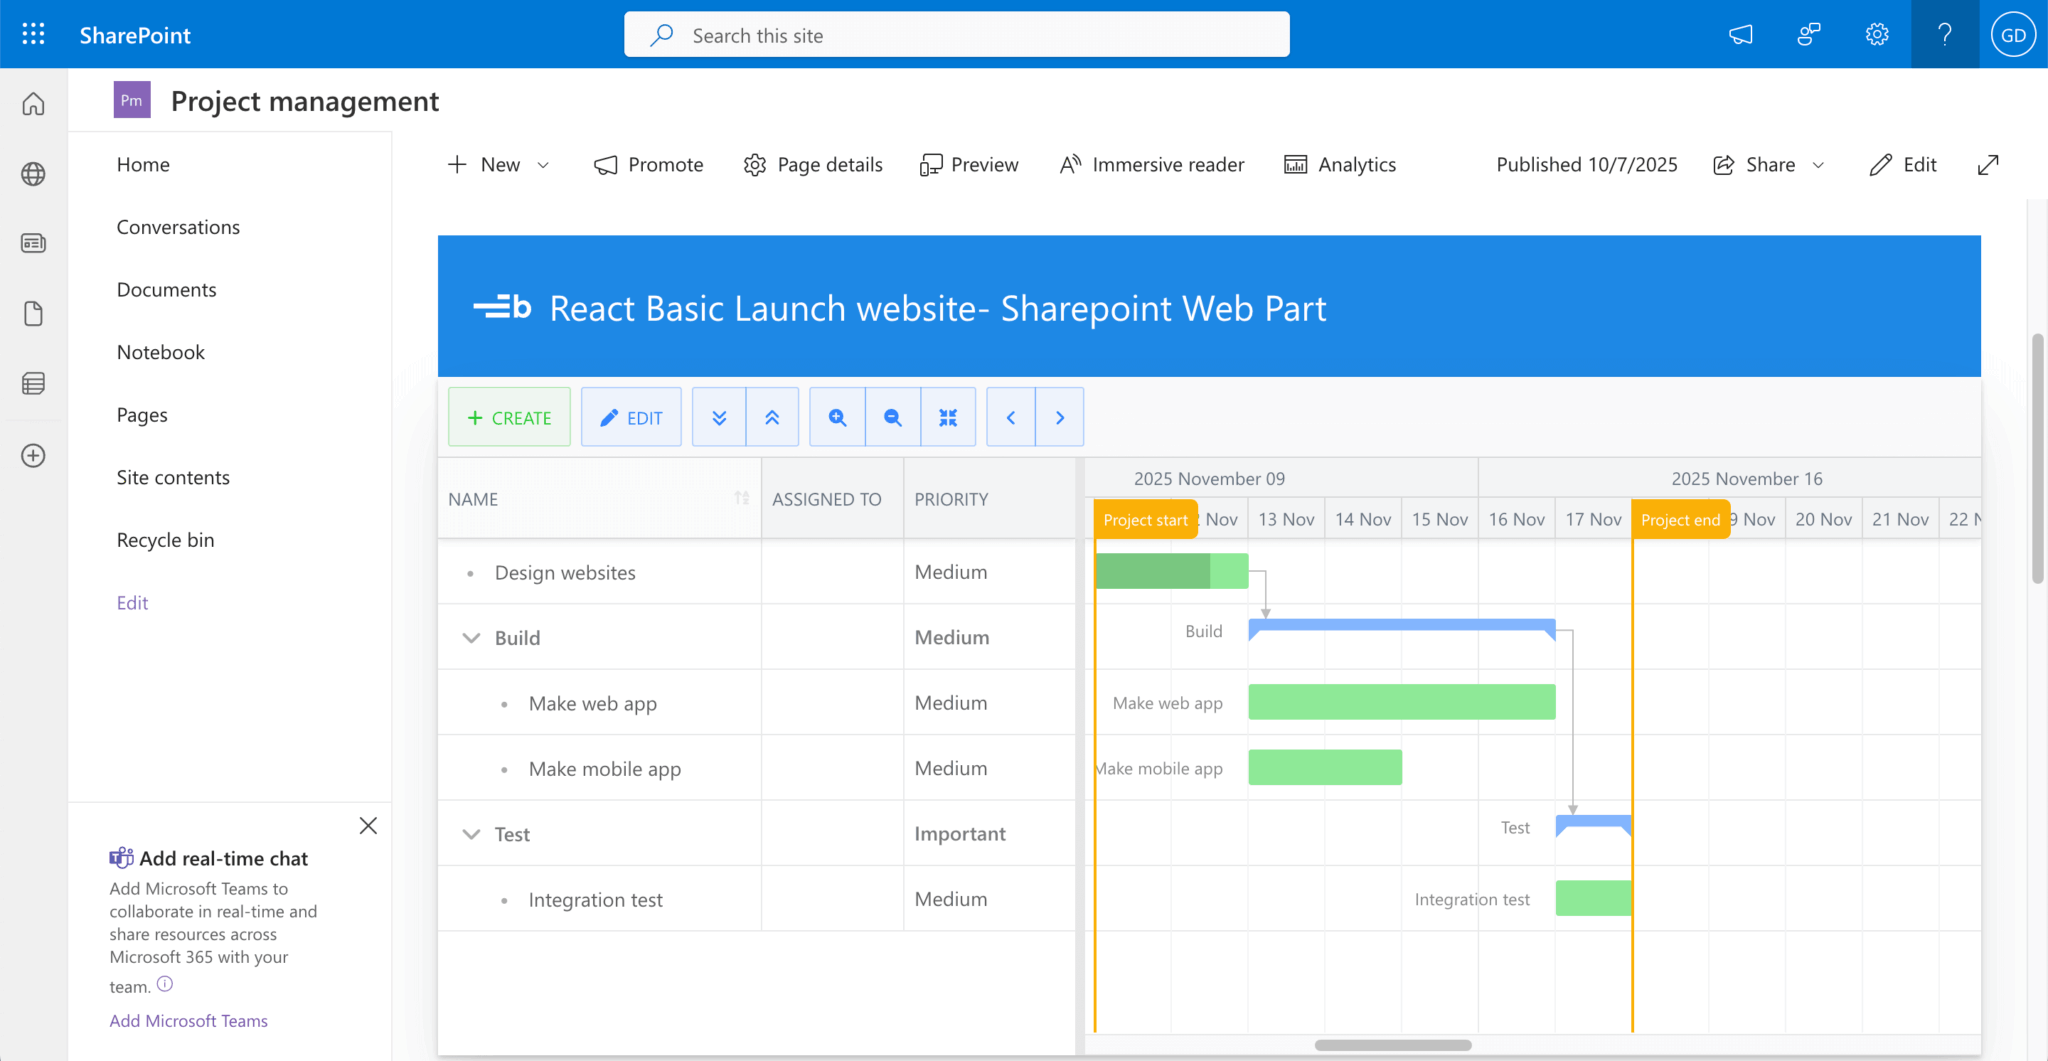
Any changes you make to the Gantt chart are saved to the Microsoft list and persisted.
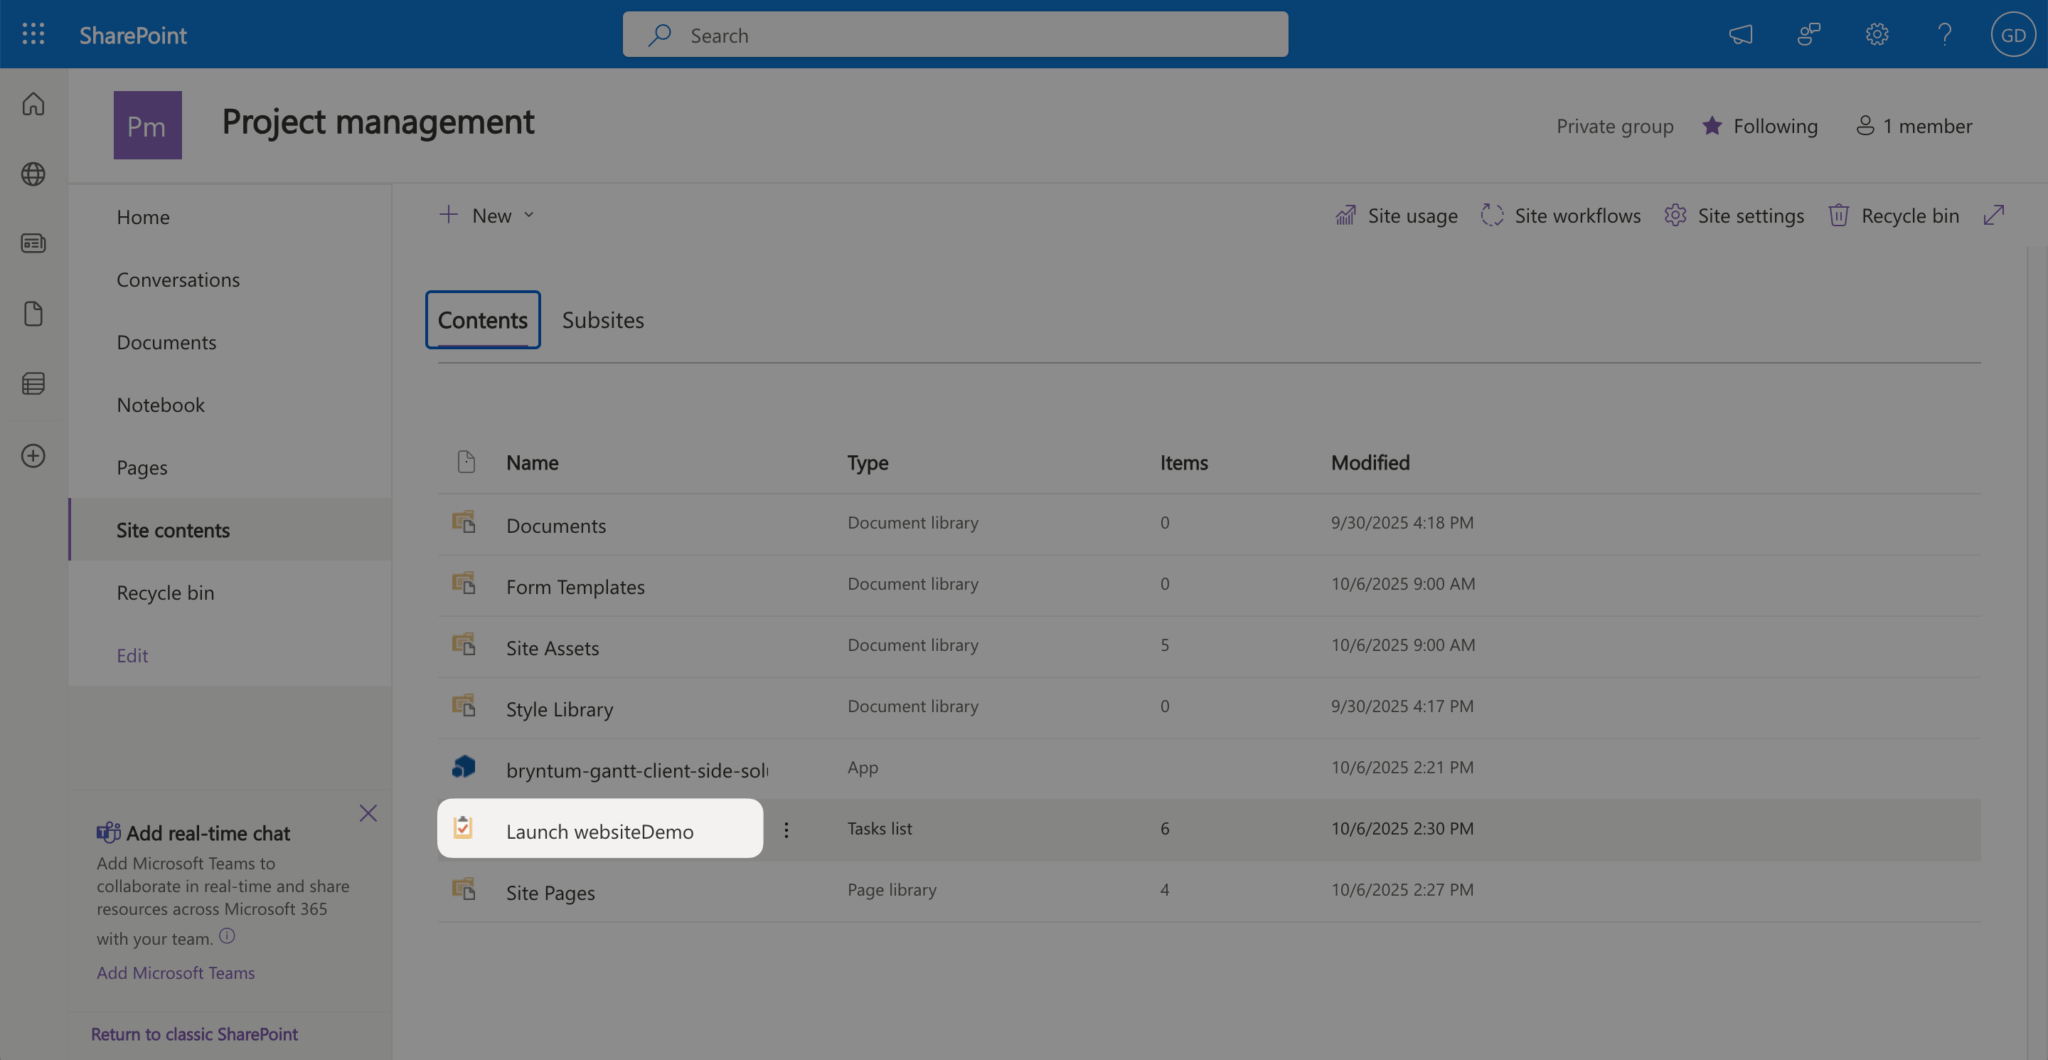
You can view the task list data source in the Site contents of your team site. Click on the Launch websiteDemo task list item.
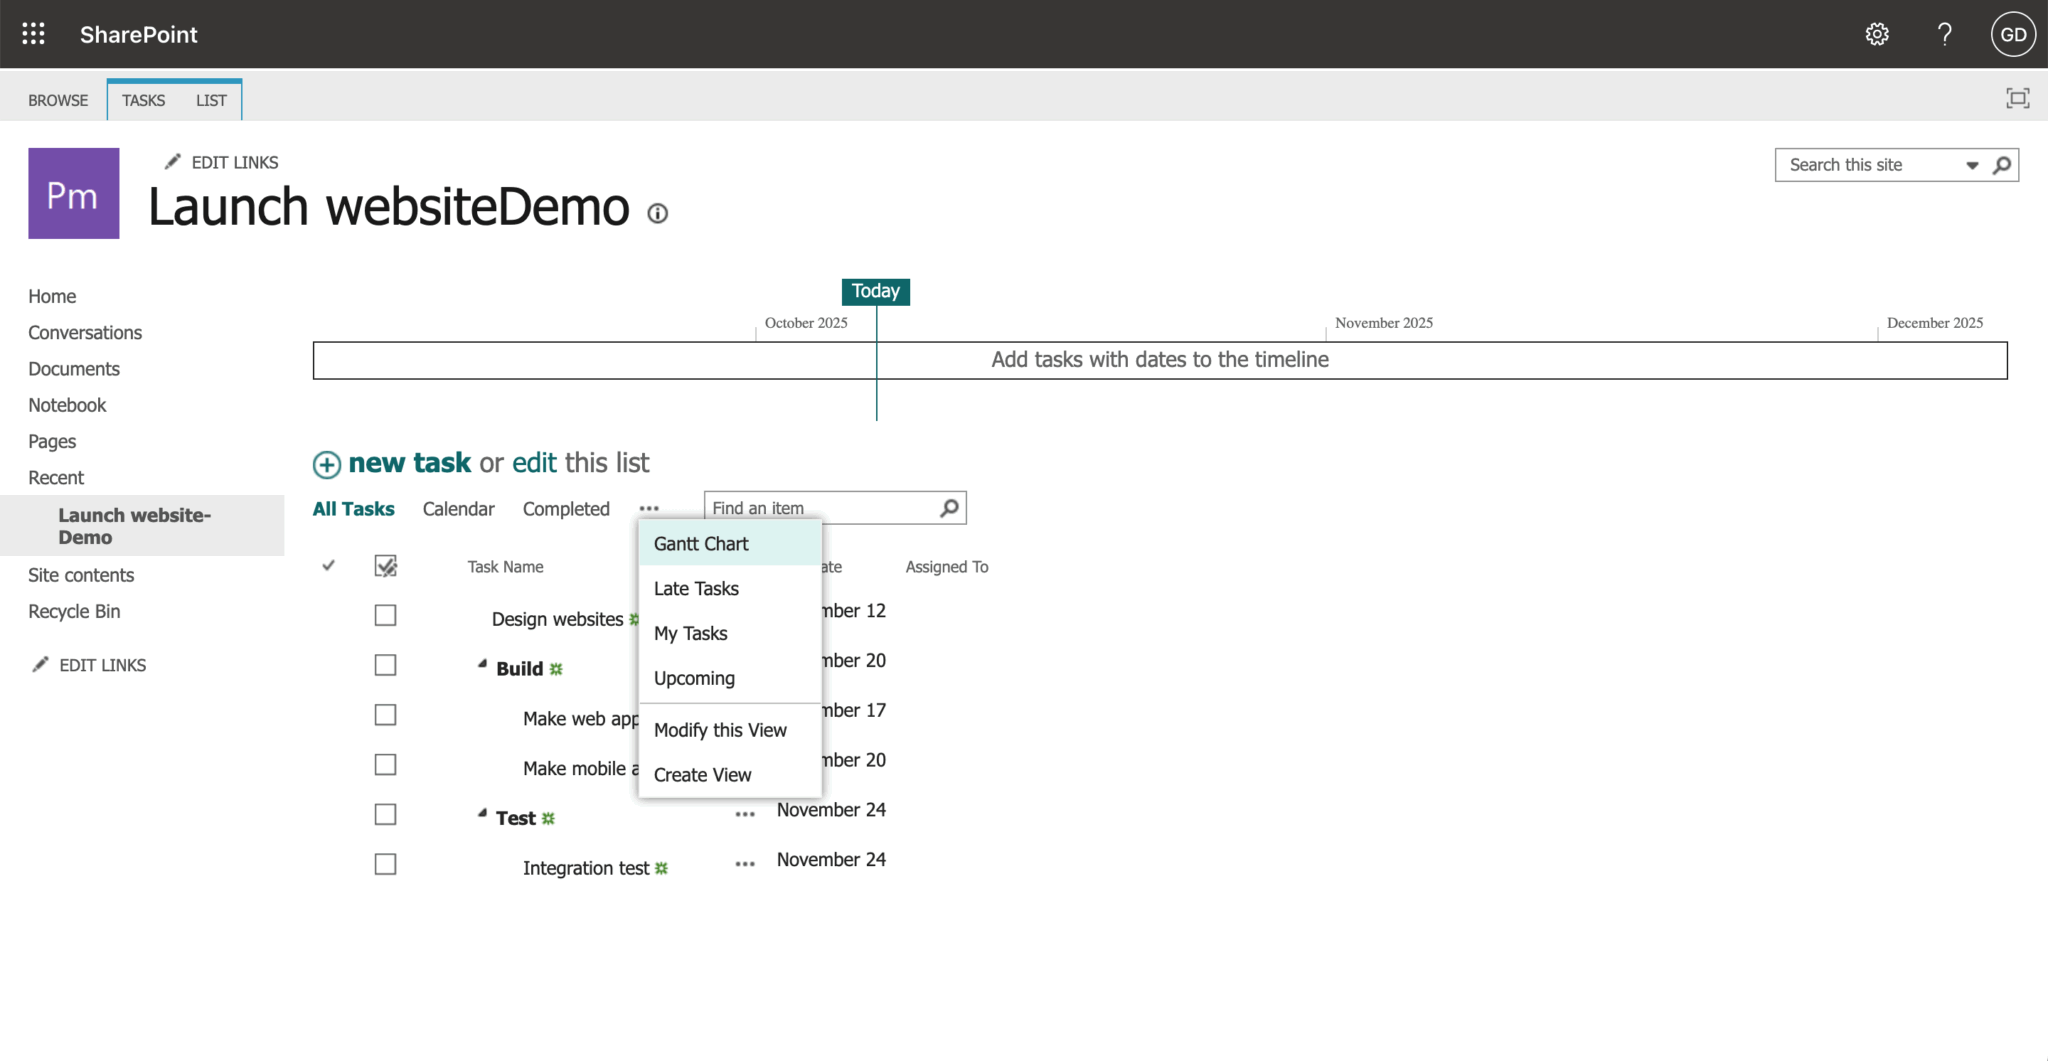
This will display the list data:
You can edit the list, and your saved edits are displayed in the Bryntum Gantt web part on your team site page. Any edits you make to the Bryntum Gantt are shown in the list.
If you click the three dots next to the Completed link, you’ll see the list data in a Gantt-chart view:

This Gantt chart has limited functionality compared to the Bryntum Gantt chart.
Conclusion
You’ve successfully migrated a Microsoft Project plan to a Bryntum Gantt chart on a Microsoft SharePoint page.
We added custom Priority and Bucket fields to the Bryntum Gantt chart. You can add other Microsoft Planner plan fields that we didn’t add, including Label, Checklist, Effort, Attachments, and Goals.
Take a look at the Bryntum Gantt demos page to browse features you can add to your Bryntum Gantt chart, including: