Finding Memory Leaks In Sencha applications
We strive to keep posts updated, but code samples may sometimes be outdated. Humans, see the Bryntum documentation; agents, https://mcp.bryntum.com for the latest info.
We recently received a bug report regarding memory leaks in our Touch Scheduler product. This was the first time we had heard of a memory issue so we decided to do a thorough investigation. Generally, debugging and finding JavaScript memory leaks can be very time consuming and tedious so it helps to know as many tricks as possible to debug efficiently. In this post I’ll share some of the techniques I used which should be useful for both anyone debugging Ext JS and Sencha Touch applications.
What is a memory leak?
A memory leak appears when a resource that’s no longer used by any part of your application still occupies memory which will never be released. This is especially bad for long running applications and for applications running on low memory devices such as phones or tablets. Determining what is a memory leak isn’t always easy since we don’t have control over the browser garbage collecting process. This prevents us from reliably knowing when the browser is done cleaning up unused JS objects, DOM nodes etc. This means we have to be extra careful and create solid test cases that can prove a memory increasing pattern over time.
Searching for memory leaks
Signs of a memory leak can be that the application is running slower over time. Also, if you’re getting reports of browsers/phones crashing, it could also be a result of an out-of-memory scenario caused by a leak. If you suspect there is a leak somewhere in your application, it’s important to first gather some evidence before starting a code review of your application. In my search for memory leaks I used the standard Chrome Dev Tools. It’s a useful tool which gives you a lot of information, but sometimes it can be hard to know what the information actually means. There’s so much information about non-leaks that finding the leak can be a very challenging task. I used the Profiles panel in the Dev Tools which looks like this:
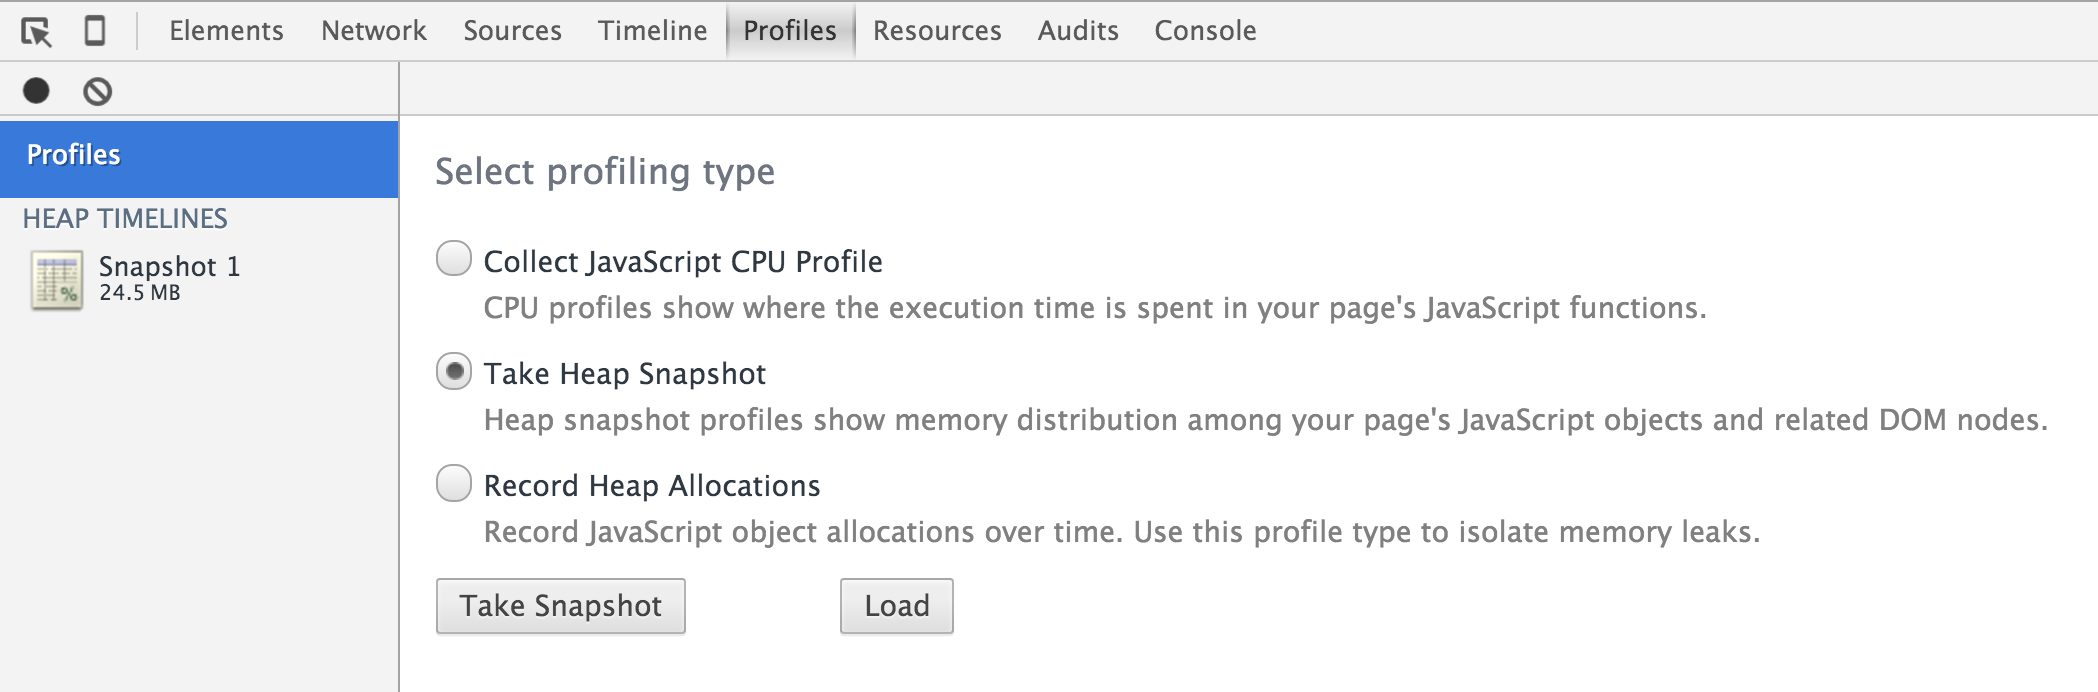
After running your application and taking a snapshot, you can look at the data gathered which most likely won’t be very helpful at the first glance. In an Ext JS application for example, there are tons of classes defined, stores loaded, elements cached etc and these are not leaks. To make a potential leak more visible in this ‘background noise’, it’s important that you run your test case many many times. If you think a certain part of your application may be leaking memory then performing a simple loop should give you good information to process.
// take snapshot before

for (var i = 0; i< 100; i++){
   openSomeDialog();
   closeSomeDialog();
}

// take snapshot after and review
The first indication of a leak is to see the memory usage go up significantly as you run your test case repeatedly.
Building a good test case
If you’re seeing something that looks like a memory leak, the next step is to create a basic test case to use. Let’s consider a simple UserList (subclassing Ext.List) in a Sencha Touch application.
Ext.define('UserList', {
    extend : 'Ext.List',
    config : {
        itemTpl    : '{name}',
        fullscreen : true
    },

    constructor : function (config) {

        var myStore = new Ext.data.Store({
            fields : ['id', 'name'],
            data   : [
                { name : 'User 1' },
                { name : 'User 2' },
                { name : 'User 3' }
            ]
        });

        this.callParent(arguments);

        this.setStore(myStore);
    }
});
An extremely simple class which actually contains a few (surprising) substantial leaks. A test case to investigate this component would look something like:
for (var i = 0; i< 100; i++){
   new UserList().destroy();
}
First we start at looking at the memory footprint when doing nothing, and again after creating and destroying the component 100 times. Tests show that memory increases 6 MB after this, which tells us we are on to something.
Making sense of the information
When studying the gathered data, I found it helpful to sort by Objects Count (since we’re creating 100 UserList objects). Now expand the Object node in the tree and hover over the top entries in search for something suspicious.
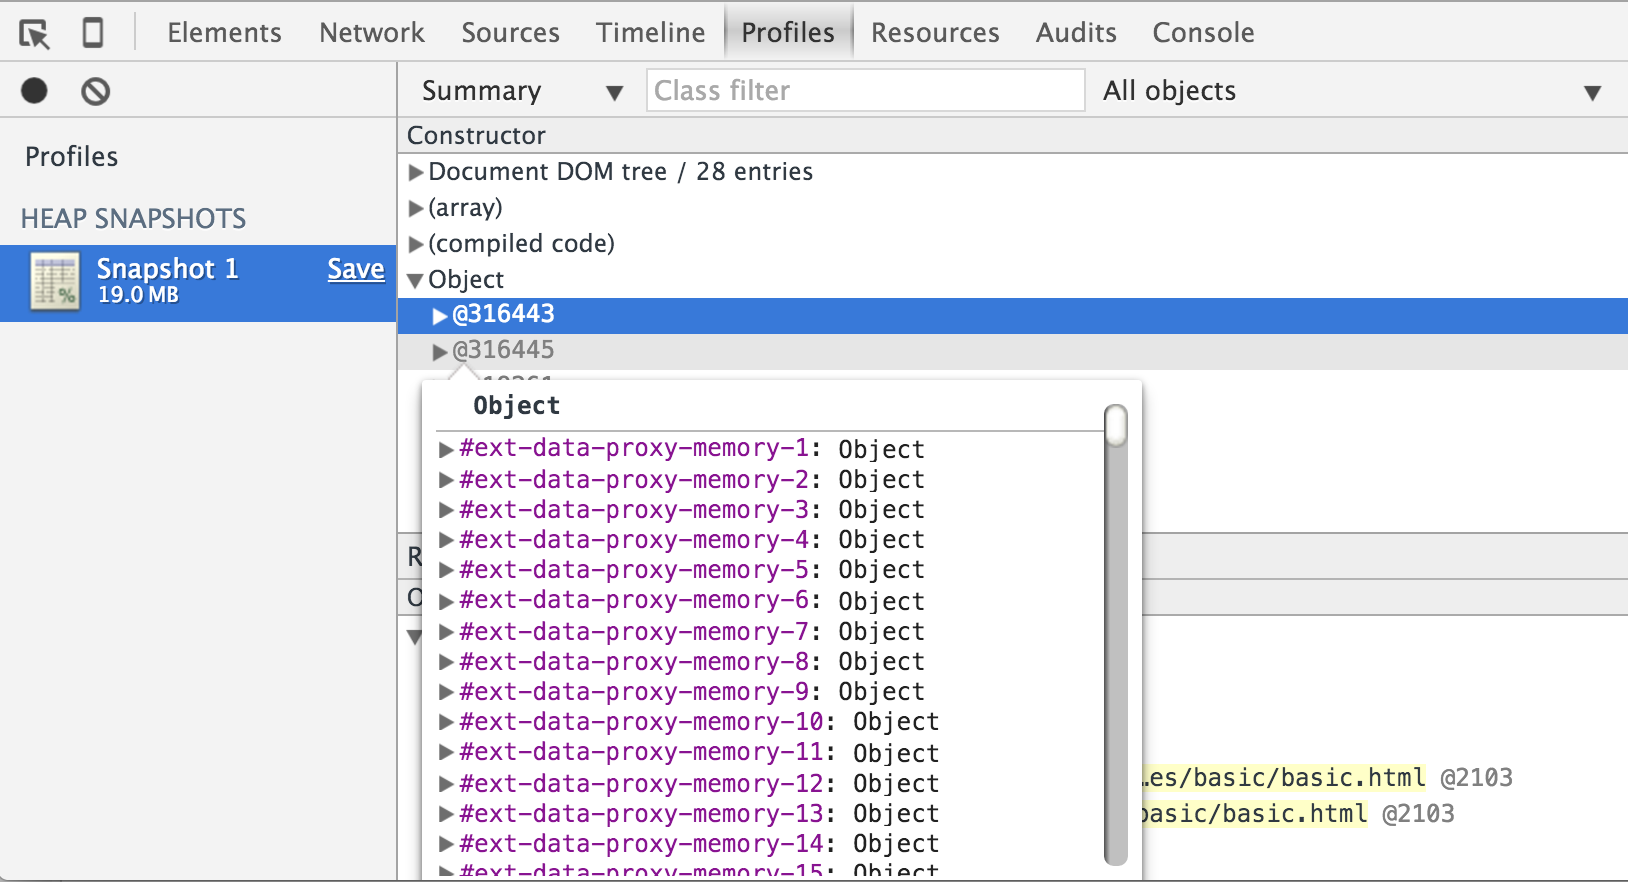
In this case, something in the tooltip looks very strange right away. Why would there be loads of Proxies floating around? Proxies are related to Stores normally, which points us towards our store creation inside our UserList component. The store is created but never destroyed (and this is fine in an Ext JS application). It turns out, in Sencha Touch even stores without a storeId are registered with the StoreManager. This means there is a reference to it and it will never be cleaned up and removed from memory. A quick test verifies our theory in the console:
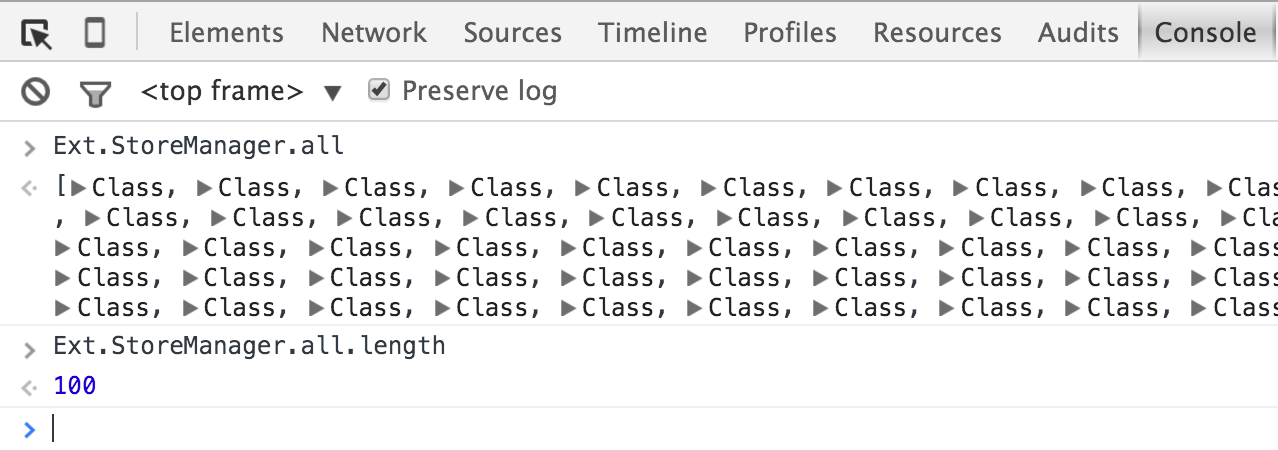
To workaround this, our component could simply destroy its store. Updated class definition:
Ext.define('UserList', {
    extend : 'Ext.List',
    config : {
        itemTpl    : '{name}',
        fullscreen : true
    },

    constructor : function (config) {

        var myStore = new Ext.data.Store({
            fields : ['id', 'name'],
            data   : [
                { name : 'User 1' },
                { name : 'User 2' },
                { name : 'User 3' }
            ]
        });

        this.callParent(arguments);

        this.setStore(myStore);
    },

    destroy : function() {
        this.getStore().destroy();
        this.callParent(arguments);
    }
});
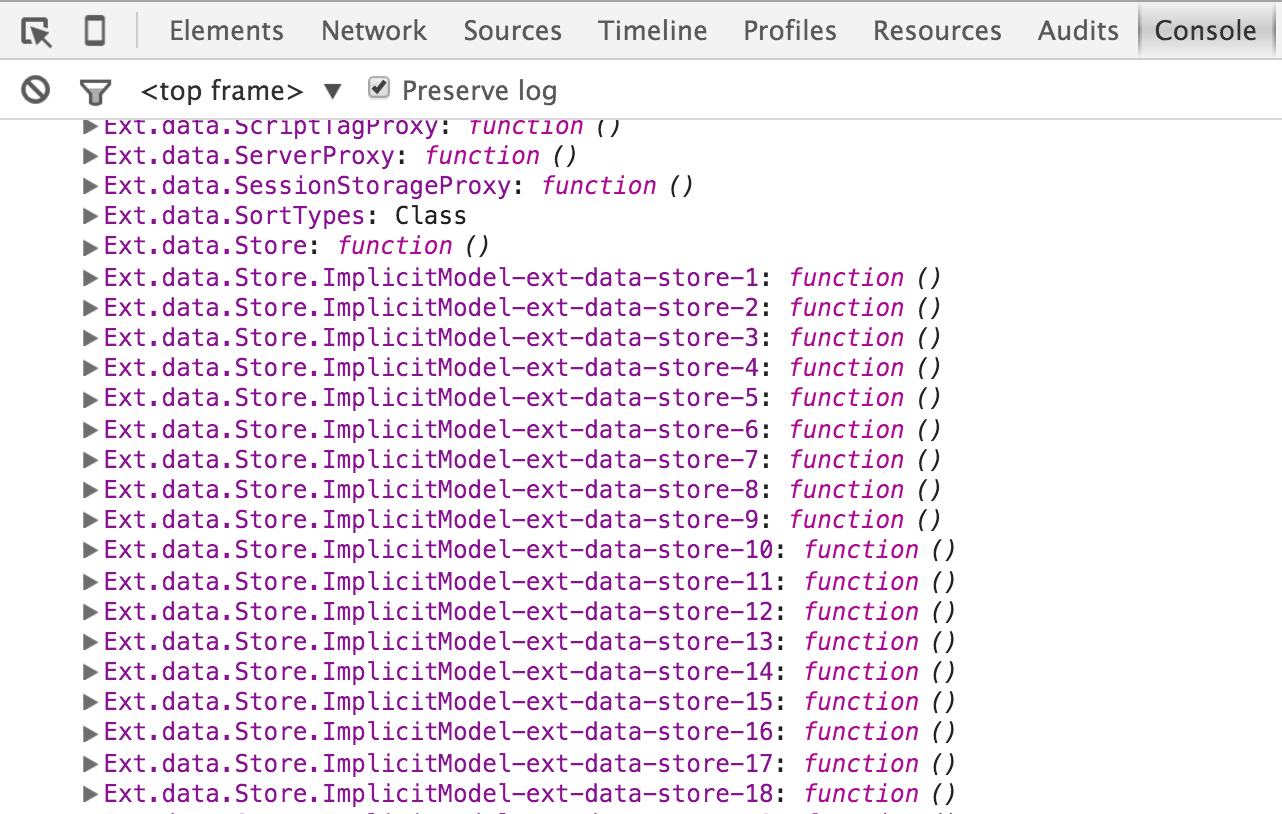
With this fix, no stores are leaked anymore. Are we done..? Let’s take another look at the memory snapshot. If we expand the ‘objectClass’ node in the report, we see a lot child nodes looking the same:
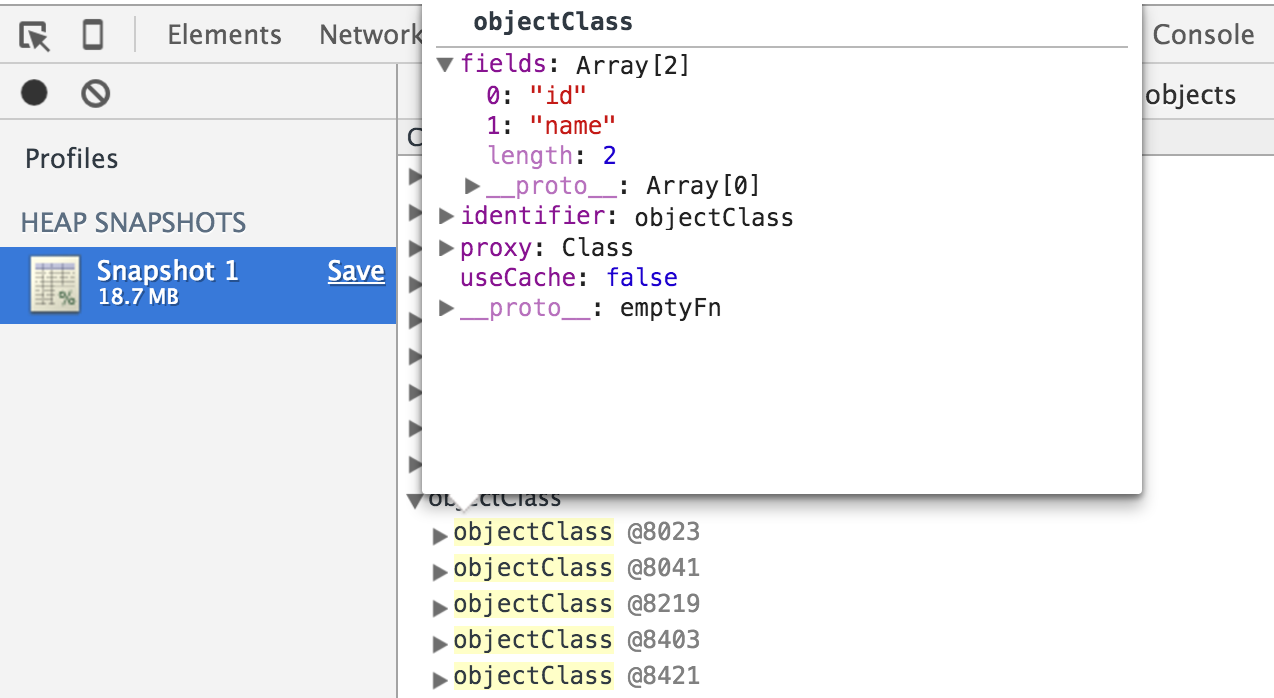
This is also very suspicious, it looks like a Model definition like the one we have specified but why so many of them? The solution is found in how the Store deals with anonymous models (using the ‘fields’ config). It defines a new Model class each time the store is created. A quick peek at Ext.ClassManager verifies this:
This is definitely not what we want, so it makes sense for us to create our own model which can be reused. As you can see, to find memory leaks you need good data to help you narrow down the suspects and it also helps being a good guesser.
Element cache leaks
Sencha Touch uses pretty aggressive caching of Ext.Element and you may end up leaking these without knowing. If you use code such as:
var childEl = someEl.down('.foo');

// or

someTemplate.insertFirst('targetEl', { foo : 'bar' });
then you will generate an entry in the Ext.Element cache. Most of the Ext.Element and Ext.Template API methods allow you to return a plain DOM node instead which saves this overhead.
Ext JS and Sencha Touch specific leaks
As a Sencha developer, here are a few places specific for Sencha Touch and Ext JS applications you should be aware of.
Ext.StoreManager contains all the stores you’ve created in your application, make sure it contains only stores you expect to see and destroy any internal stores when they’re no longer used.
Ext.ClassManager contains all the classes defined in your application as well as all the Sencha classes, make sure it contains only classes you expect to see.
Ext.Element.cache contains all cached Ext.Element references. Avoid using Element.down and similar APIs unless you really need an Ext.Element instance.
Ext.ComponentManager contains all cached Component instances. If you create a component and forget to destroy it, it’ll still be kept in the cache.
Ext.event.Dispatcher.getInstance() If you forget to destroy an Observable you’ll see an entry leaked in this object.
What all of the global caches above have in common is that it’s super easy to verify leaks. Simply measure number of members in those classes prior to running your test case and assert that the value stays the same after your test case.
Locking it down with a Siesta test case
The debugging process to find the leaks in our Touch Scheduler took 8-12 hours which is quite a lot of work. We definitely need to add a detection mechanism to make sure this doesn’t sneak back in. This is easily done with a Siesta test case:
describe('Panel should not leak stores, classes, elements', function (t) {

    t.it('Should not leak memory', function (t) {
        var nbrStoresBefore      = Ext.StoreManager.getCount();
        var nbrClassesBefore     = Object.keys(Ext.ClassManager.classes).length;
        var observableBefore     = Object.keys(Ext.event.Dispatcher.getInstance().listenerStacks.observable || {}).length;
        var elementBefore        = Object.keys(Ext.event.Dispatcher.getInstance().listenerStacks.element || {}).length;
        var componentBefore      = Object.keys(Ext.event.Dispatcher.getInstance().listenerStacks.component || {}).length;
        var cachedElementsBefore = Object.keys(Ext.Element.cache).length;

        var steps = [];
        var scheduler;

        for (var i = 0; i < 10; i++) {

            steps.push([
                function (next) {
                    scheduler = t.getRenderedScheduler({
                        startDate : new Date(2016, 1, 1),
                        endDate   : new Date(2016, 1, 11),
                        plugins   : [
                            new Sch.plugin.CurrentTimeLine()
                        ]
                    });


                    t.waitForRowsVisible(scheduler, next);
                },

                function (next) {
                    scheduler.zoomIn();
                    t.waitFor(50, next);
                },
                function (next) {
                    scheduler.zoomOut();
                    t.waitFor(50, next);
                },

                function (next) {
                    scheduler.destroy();
                    scheduler.eventStore.destroy();
                    scheduler.resourceStore.destroy();
                    scheduler.timeAxis.destroy();

                    next()
                }
            ])
        }

        t.chain(
            steps,

            function () {
                t.is(Object.keys(Ext.Element.cache).length, cachedElementsBefore, 'No extra cached elements found')

                Ext.Viewport.destroy();

                t.is(Ext.StoreManager.getCount(), nbrStoresBefore, 'No leaked stores found')
                t.is(Object.keys(Ext.ClassManager.classes).length, nbrClassesBefore, 'No leaked classes found')
                t.is(Object.keys(Ext.data.Model.cache).length, 0, 'No cached models found')

                t.it('should not find any leaked listener objects', function (t) {

                    t.is(Object.keys(Ext.event.Dispatcher.getInstance().listenerStacks.observable).length, observableBefore, 'observable')
                    t.is(Object.keys(Ext.event.Dispatcher.getInstance().listenerStacks.element).length, elementBefore, 'element')
                    t.is(Object.keys(Ext.event.Dispatcher.getInstance().listenerStacks.component).length, componentBefore, 'component')
                })
            })
    })
})
Summing up
Keeping track of memory in mobile apps or web apps that should run for a very long time is important. I hope the techniques outlined above can help you manage the memory footprint in your own applications. Do you have any good tricks of your own to share? We’d be very happy to hear your own experiences when chasing memory leaks.