Build a location-based scheduler with Mapbox using Bryntum

We strive to keep posts updated, but code samples may sometimes be outdated. Humans, see the Bryntum documentation; agents, https://mcp.bryntum.com for the latest info.
Do you need a scheduler that can handle location data? Our extensible Bryntum Scheduler Pro allows you to integrate a map using your favorite JavaScript map library. Bryntum Scheduler Pro is an even more feature-rich version of our Bryntum Scheduler, with additional features like a powerful scheduling engine, highlighting, constraints, custom event grouping, event splitting, and nested events. To find out more about the differences between the two Bryntum Scheduler options, take a look at our article: Scheduler vs. Scheduler Pro.
In this tutorial, we’ll add a map-view panel to a work task scheduler. We’ll use the Mapbox GL JS library to create an interactive map showing the address at which each task occurs. Alternatively, you could use the Google Maps JavaScript API or OpenStreetMap. In terms of map customization, Mapbox is a good choice, as you can create custom maps using Mapbox Studio and it has good documentation and rendering performance.
In this tutorial, we’ll do the following:
- Create a custom MapPanel Widget that displays a Mapbox map.
- Add map markers for each work task event.
- Customize the task editor by adding a custom address field.
- Make the address field dropdown a search input. We’ll search for location data from the Nominatim API.
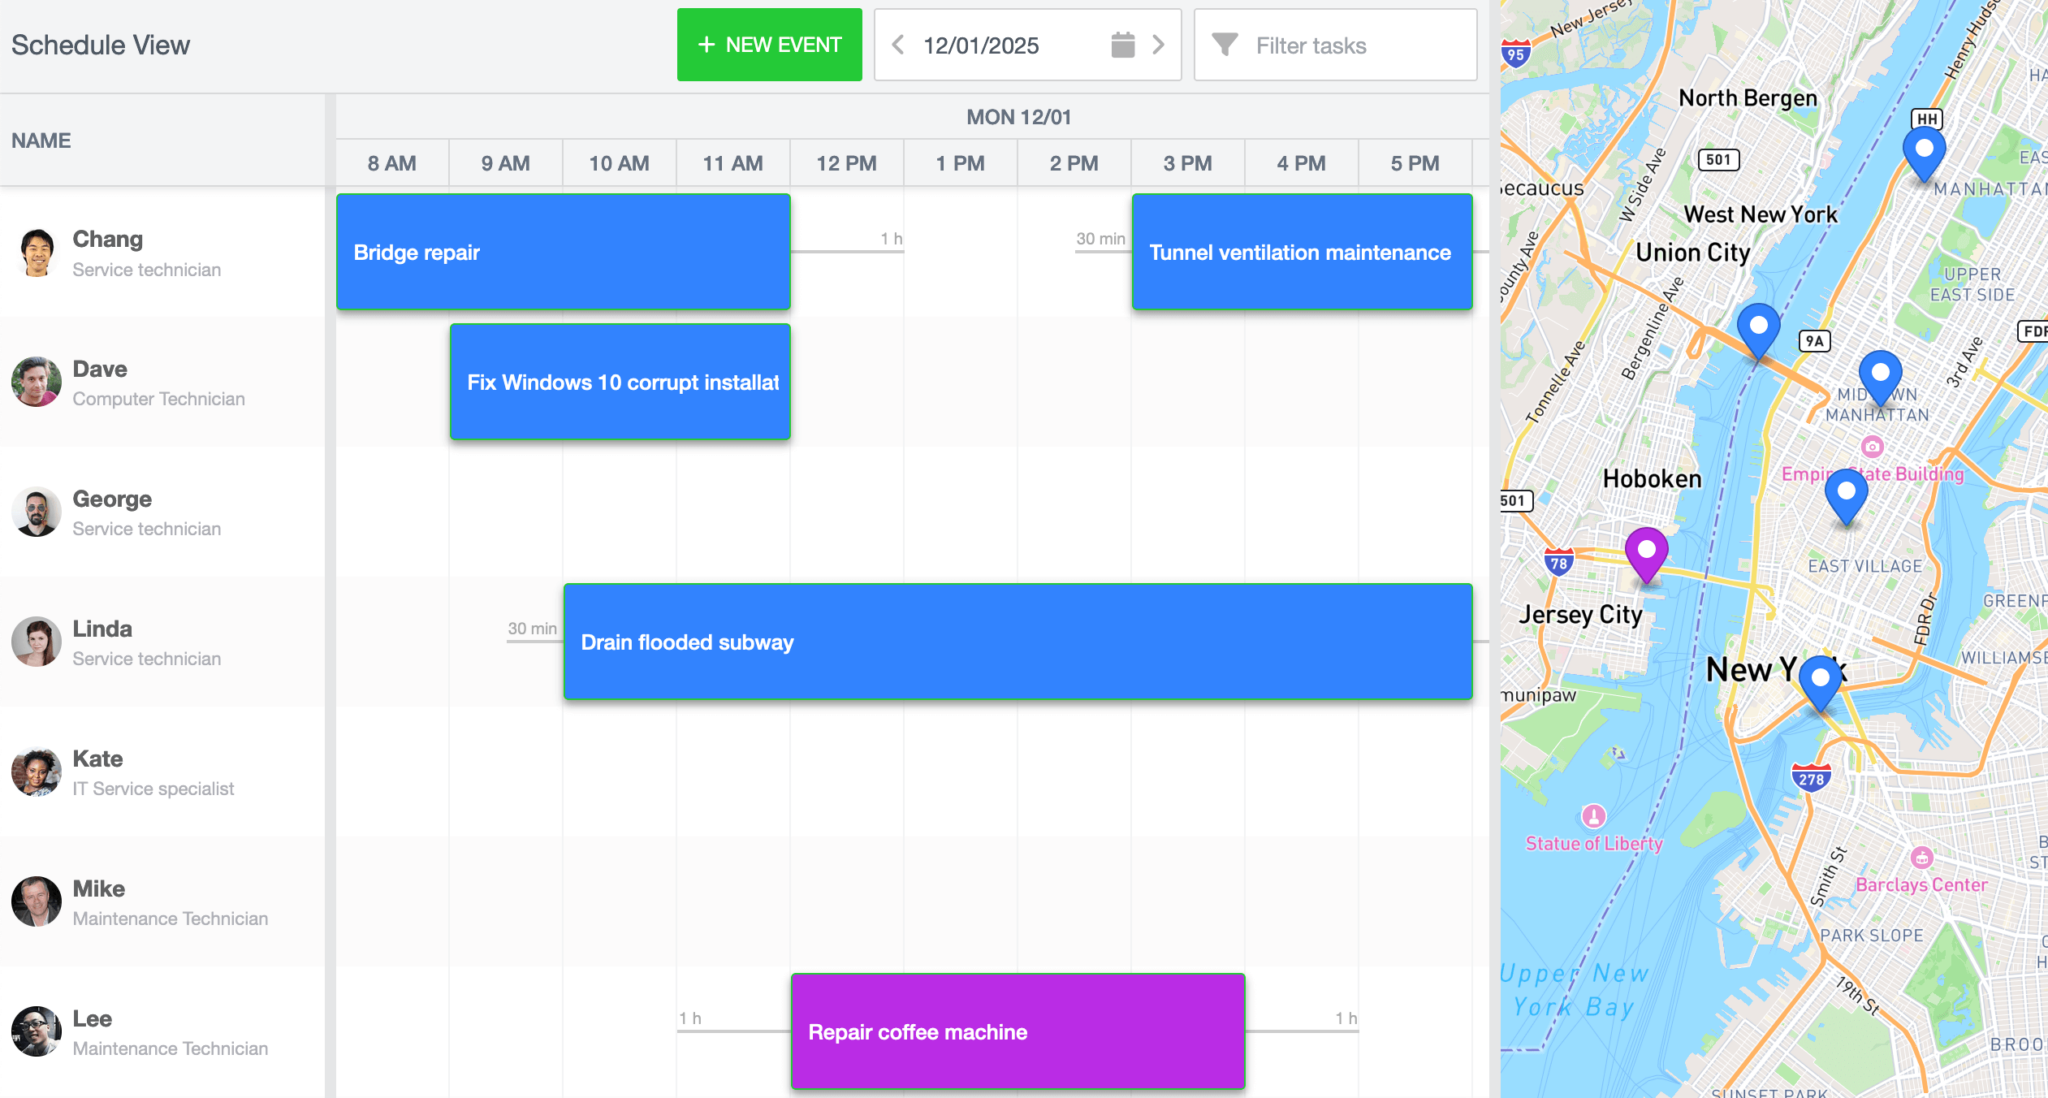
Once you’re done with this tutorial, you’ll have a location-based work task scheduler that looks like the one shown in the image below:
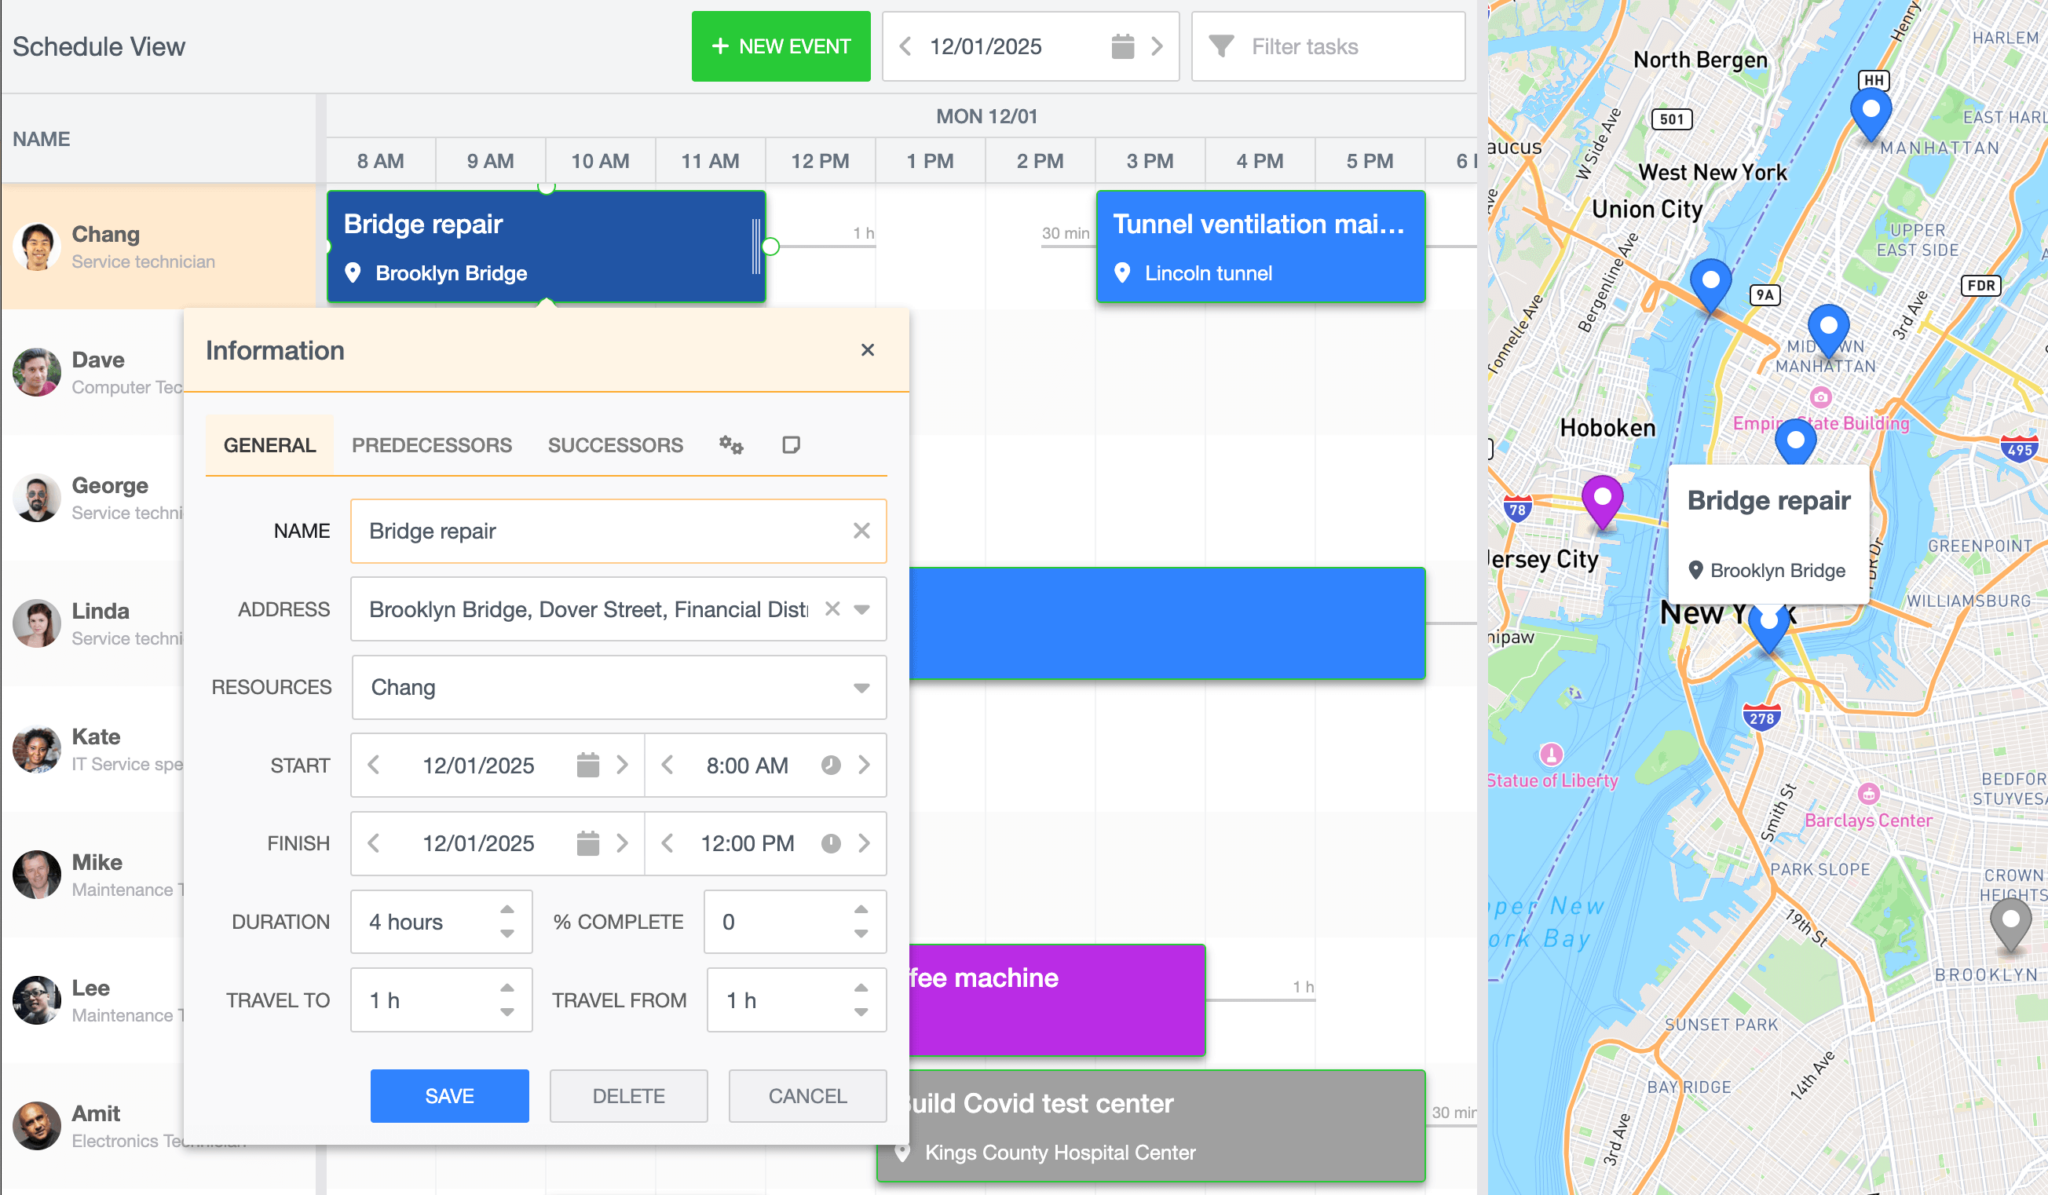
You can find the code for the completed scheduler in our GitHub repository on the “complete-scheduler” branch.
Getting started
We’ll start by cloning the following Scheduler Pro Mapbox integration starter GitHub repository. The starter repository uses Vite, which is a development server and JavaScript bundler. Install the Vite dev dependency by running the following command: npm install.
The starter repository contains code for a working work scheduler app without the Mapbox integration.
You can try out Bryntum components for free using our public Bryntum trial packages.
If you have a Bryntum license, please refer to our npm Repository Guide to access the private Bryntum repository.
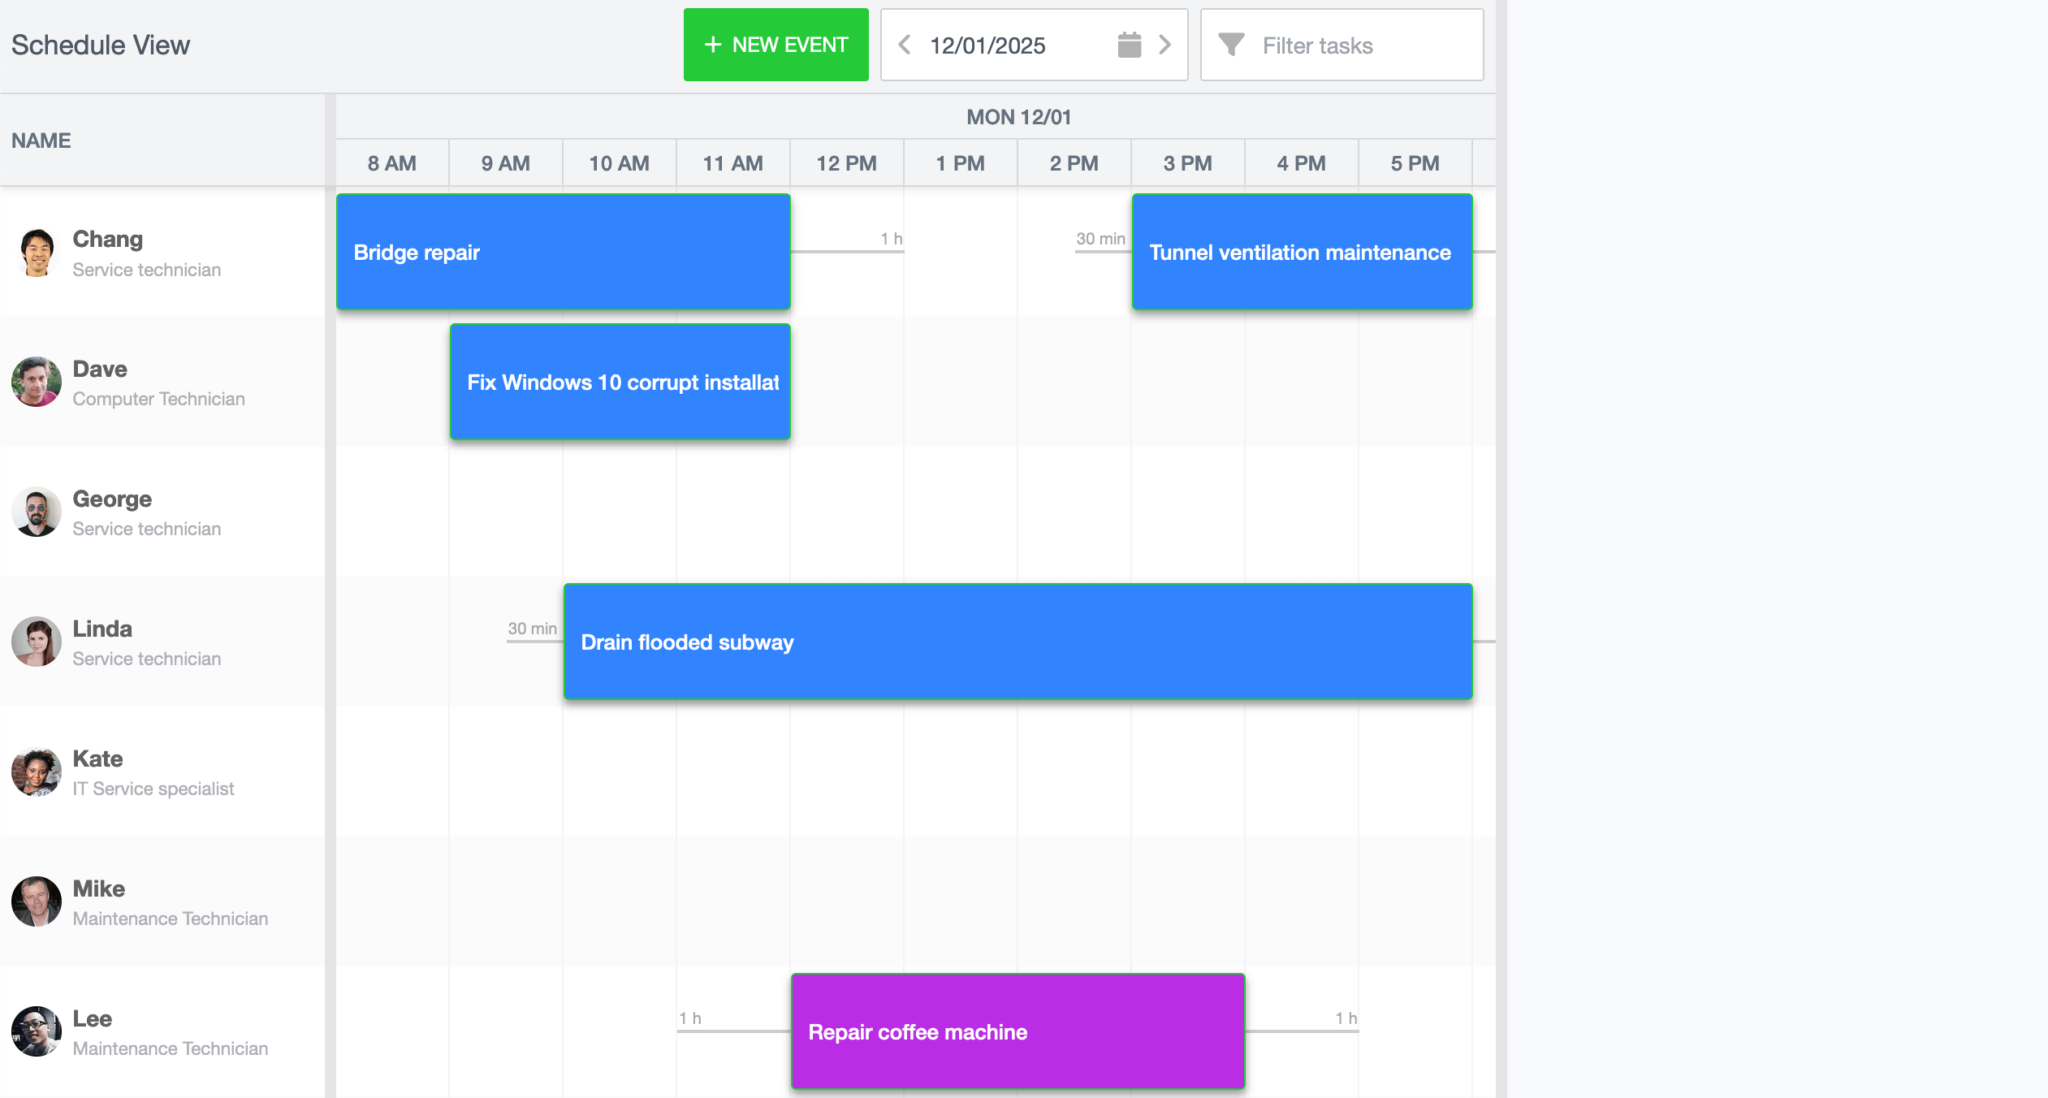
Once you’ve installed the Scheduler Pro component, run the local development server using npm run dev. You’ll see the working scheduler app as shown below:
The following table explains the contents of some of the starter repository’s files and folders:
| File / folder | Contents |
|---|---|
main.js | JavaScript file where the custom Bryntum Scheduler Pro is configured. |
/lib/Schedule.js | JavaScript file where the custom Bryntum Scheduler Pro Class is defined. |
/data/data.json | Data for resources and events. The resources for the scheduler are the workers and the events are the work events. |
/public/data/resources | Images for the workers that are displayed in the “NAME” column of the scheduler. |
Note that the non-minified Bryntum theme CSS file is imported in Schedule.js:
import "@bryntum/schedulerpro/schedulerpro.stockholm.css";The fully-licensed versions of Bryntum components come with minified versions of the JavaScript and CSS files, which reduces your bundle size. If you have the licensed version of the Scheduler Pro, you can change the file extension of the imported CSS theme file to min.css:
import "@bryntum/schedulerpro/schedulerpro.stockholm.min.css";You can learn more about the performance optimizations that come with using a licensed version of our products in our article: Build a production grade application with the licensed distribution.
In the main.js file, the scheduler’s data stores are populated using the project property, which acts as a crudManager for loading data:
project: {
  autoLoad: true,
  eventStore: {
    modelClass: Task,
  },
  transport: {
    load: {
      url: "data/data.json",
    },
  },
  // This config enables response validation and dumping of found errors to the browser console.
  // It's meant to be used as a development stage helper only, so please set it to false for production systems.
  validateResponse: true,
},
The transport property is used to configure the AJAX requests used by the Crud Manager to communicate with a server. In this tutorial, we simulate getting data from a server for simplicity by getting data from the data.json file in the public folder. You can configure the transport property to sync data changes to a specific backend URL. For more information, you can read the following guide in our docs: Saving data.
The eventStore holds the data for our work tasks. It uses the custom Task model in Task.js that extends the Scheduler Pro EventModel. The custom Task model customizes the default DurationField in the task editor by setting its default value and duration unit. Later in the tutorial, we’ll add an address field object to show location data. The address field will be an object containing a display name, latitude, and longitude for a location. The events from our data source, data.json, contain an address property that will be used when we integrate Mapbox into our scheduler.
The resourceImagePath property of the custom Schedule class in Schedule.js contains the path to load the images of the workers in the “NAME” column of the scheduler:
resourceImagePath: "resources/",The images are stored in the resources folder, which is in the public folder.
Now let’s add an interactive map to our scheduler to show the location of tasks using Mapbox.
Creating a custom map panel widget and checking for browser WebGL support
We’ll create a custom Panel widget that will contain our Mapbox map. Create a new file called MapPanel.js in the lib folder and add the following lines of code to it:
import { Panel } from "@bryntum/schedulerpro";
// A simple class containing a MapboxGL JS map instance
export default class MapPanel extends Panel {
  // Factoryable type name
  static get type() {
    return "mappanel";
  }
  // Required to store class name for IdHelper and bryntum.query in IE11
  static get $name() {
    return "MapPanel";
  }
}
// Register this widget type with its Factory - the Widget class
MapPanel.initClass();
The MapPanel widget is a custom Panel widget class with additional methods. The static getter method type() is the widget name alias that can be used to reference the widget. The initClass() method registers our custom MapPanel widget with the Widget base class, which allows it to be created by type. We’ll add more methods to our MapPanel class when we add the Mapbox GL JS library.
Now we’ll add an instance of our MapPanel to our app. It will be placed next to the scheduler. In the main.js file, import the following widgets:
import { Splitter, Toast } from "@bryntum/schedulerpro";
import MapPanel from "./lib/MapPanel.js";
Below the imports, add the following function:
const detectWebGL = () => {
  try {
    const canvas = document.createElement("canvas");
    document.body.appendChild(canvas);
    const supported = Boolean(canvas.getContext("webgl"));
    canvas.remove();
    return supported;
  } catch (e) {
    return false;
  }
};
let mapPanel;
This function returns true if the browser supports WebGL and false if it doesn’t. The Mapbox GL JS library requires WebGL. You can also use Mapbox.js as a fallback if needed. The Mapbox docs have a tutorial that shows you how to do this.
We also declare the mapPanel variable, which is initially undefined. We’ll define it if the browser supports WebGL.
Now add the following code below the definition of the schedule variable:
// A draggable splitter between the two main widgets
new Splitter({
  appendTo: "main",
});
if (detectWebGL()) {
  // A custom MapPanel wrapping the Mapbox GL JS map. We provide it with the timeAxis and the eventStore
  // so the map can show the same data as seen in the schedule.
  mapPanel = new MapPanel({
    ref: "map",
    appendTo: "main",
    flex: 2,
    eventStore: schedule.eventStore,
    timeAxis: schedule.timeAxis,
  });
} else {
  Toast.show({
    html: `ERROR! Cannot show maps. WebGL is not supported!`,
    color: "b-red",
    style: "color:white",
    timeout: 0,
  });
}
The Splitter widget allows us to resize the map panel. If the browser supports WebGL, we assign the mapPanel variable to a new MapPanel widget. We pass the scheduler’s work tasks event data and timeAxis data so that we can show the same scheduler data, as seen in our scheduler, on our map. If we zoom in to our scheduler so that only some of the work tasks are shown, the timeAxis data will allow us to only show on the map the tasks that are shown on the scheduler.
If WebGL is not supported, the Toast widget displays an error message.
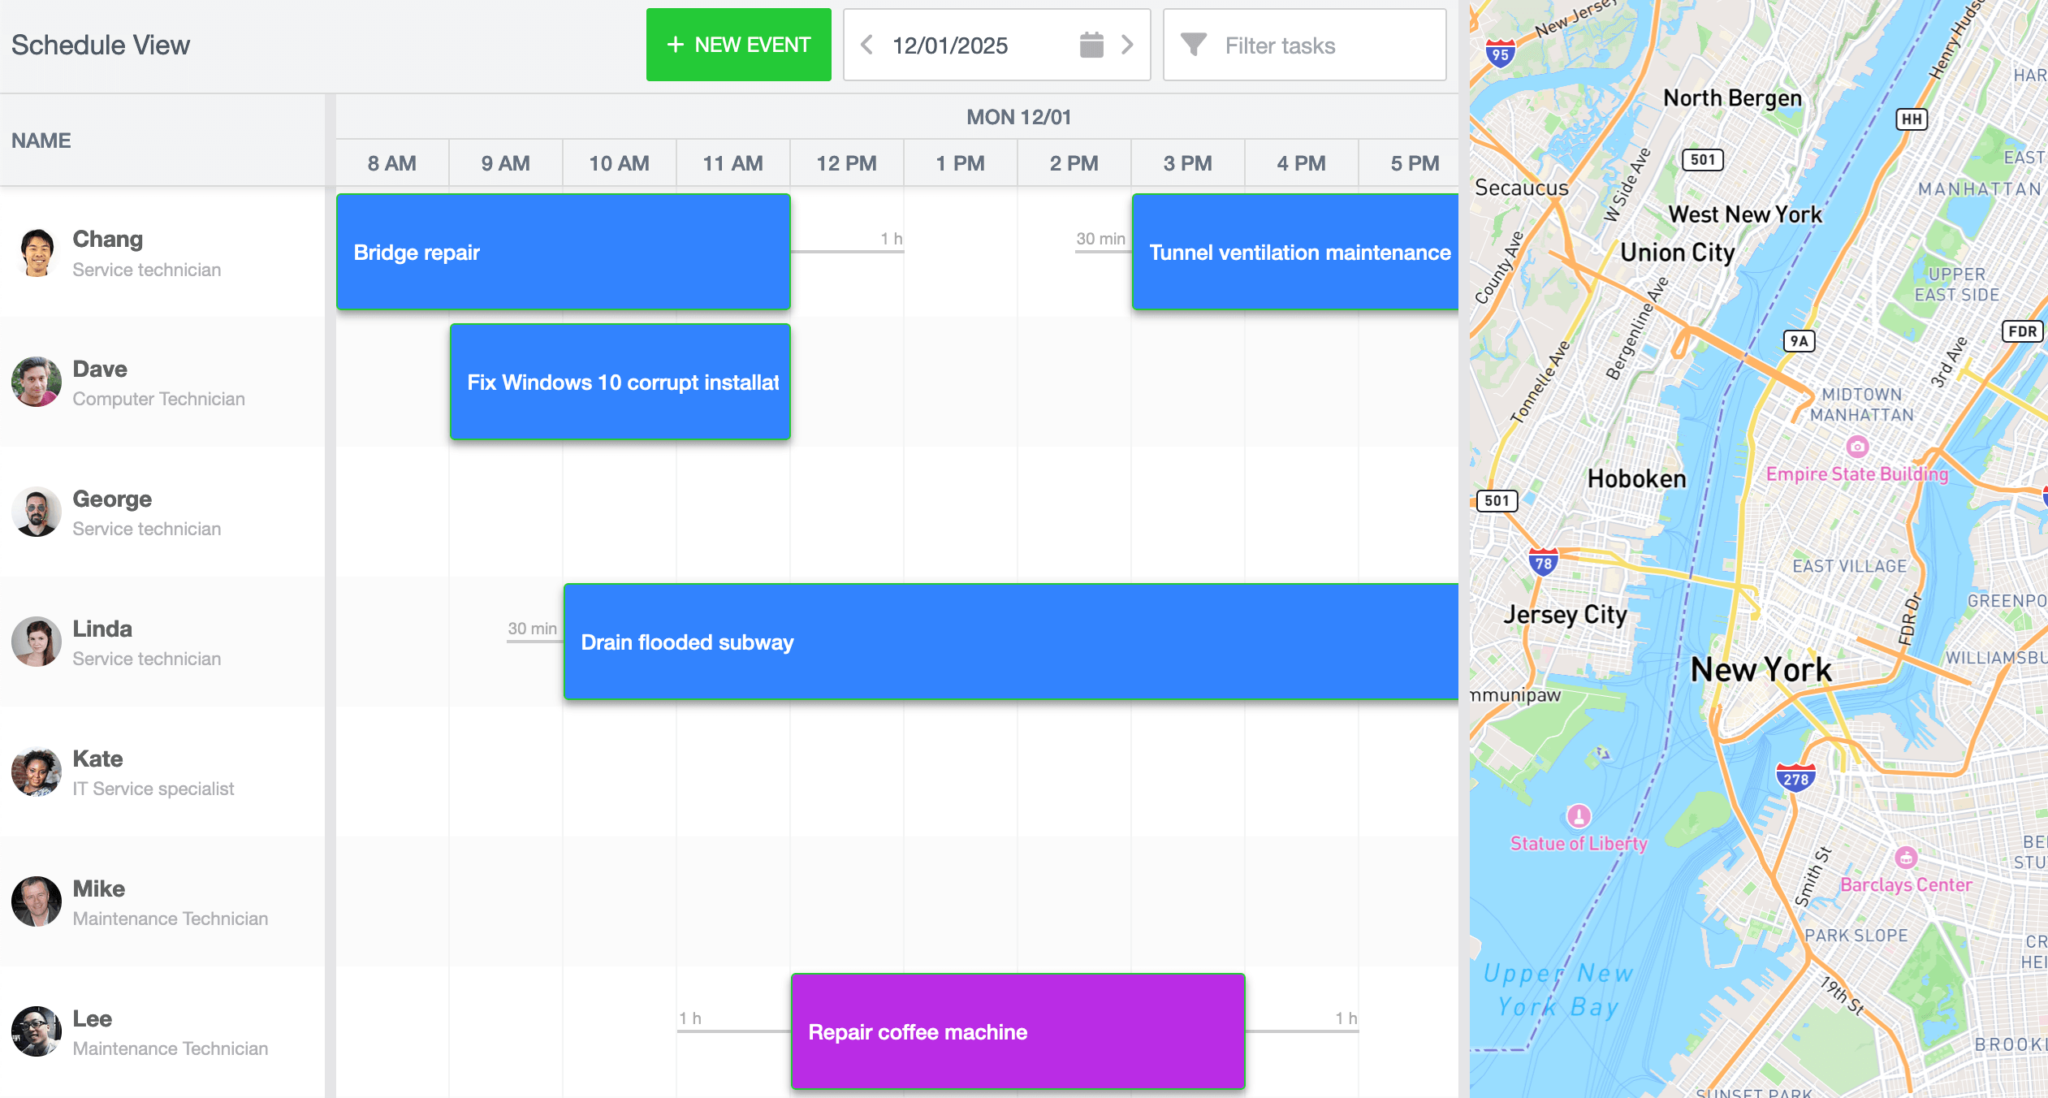
You’ll now see a resizable custom MapPanel widget on the right-hand side of the scheduler:
Creating a Mapbox account and getting a public key
To use any of Mapbox’s tools, APIs, or SDKs, you’ll need a Mapbox access token. First, sign up for a Mapbox account if you don’t have one already. You can start using it for free, Mapbox offers a generous free usage tier. If you sign up using a personal email address, you’ll need to add bank card details for payment. If you use your organization’s email address, you won’t need to add bank card details. You can learn more about Mapbox pricing in the docs:
Log in to your Mapbox account and go to the Access Tokens page, which you can navigate to from the “Tokens” navbar menu link. You’ll see the default public token. Your account will always have at least one public-access token. The token string starts with “pk.”. We’ll use this public access token to make requests to Mapbox GL API endpoints.
Adding the Mapbox GL JS library
In the index.html file, add the Mapbox GL JS library files within the <head> tag:
<script src="https://api.tiles.mapbox.com/mapbox-gl-js/v2.9.2/mapbox-gl.js"></script>
<link href="https://api.tiles.mapbox.com/mapbox-gl-js/v2.9.2/mapbox-gl.css" rel="stylesheet"/>
In the MapPanel.js file, add your Mapbox public access token to the global mapboxgl module, below the Panel import:
mapboxgl.accessToken = "<your-mapbox-accessToken>";Add the following static getter method to the MapPanel custom widget class:
static get defaultConfig() {
  return {
    monitorResize: true,
    // Some defaults of the initial map display
    zoom: 11,
    lat: 40.7128,
    lon: -74.006,
    textContent: false,
  };
}
This method adds some default settings to the displayed map.
Now add the following construct method below the defaultConfig method:
construct(config) {
  const me = this;
  super.construct(config);
  const mapEl = me.bodyElement;
  // NOTE: You must use your own Mapbox access token
  me.map = new mapboxgl.Map({
    container: mapEl,
    style: "mapbox://styles/mapbox/streets-v12",
    center: [me.lon, me.lat],
    zoom: me.zoom,
  });
}
The construct function is used to initialize map properties of the MapPanel when an instance is constructed. The construct config is passed to the parent class’s construct function. The parent class is Widget.
A new Mapbox map is initialized and added to the MapPanel map property. The map requires a map style. There are various Mapbox-owned styles to choose from, as can be seen in the following Mapbox styles table. The code example above uses the Mapbox Streets style. Feel free to change the map style by pasting in a different style URL. You can also create your own map style using the Mapbox Studio style editor as shown in the following Mapbox tutorial: Create a map style.
You’ll now see a Mapbox map in the map panel:
You can click and drag to pan across the map, mouse wheel scroll to zoom in and zoom out, and you can change the rotation or pitch of the map by clicking and dragging the cursor while holding down the right mouse button or the control key. These user-interaction events can be customized. To learn more, see the following section in the Mapbox docs: User interaction handlers.
If you resize the map panel, the Mapbox map won’t resize. To fix this, add the following method to the MapPanel class:
onResize() {
  // This widget was resized, so refresh the Mapbox map
  this.map?.resize();
}
When the map panel widget is resized, the Mapbox map will be resized.
Now let’s get our work task events on the map.
Adding map markers for work task events
We’ll add map markers to our map to show the location of our work task events. In the MapPanel.js file, add the following event listener with a callback function in the construct() method:
// First load the map and then set up our event listeners for store CRUD and time axis changes
me.map.on("load", () => {
  me.eventStore.on("change", me.onStoreChange, me);
  // If data loaded before the map, trigger onStoreChange manually
  if (me.eventStore.count) {
    me.onStoreChange({ action: "dataset", records: me.eventStore.records });
  }
});
Once the map has loaded, a change in the scheduler event data causes the onStoreChange method to be called. We’ll define this method soon.
The map panel’s event store is our scheduler’s event store, as can be seen in the mapPanel config in the main.js file. The scheduler’s on() method adds a change event listener to the scheduler’s event store.
The change event passes a Bryntum event object to the onStoreChange() callback function. The properties of this event object include an action property and a records property. The action is the name of the action that triggered the event. The possible action names are: "remove", "removeAll", "add", "updatemultiple", "clearchanges", "filter", "update", "dataset", and "replace". The records property is the changed event records. These are passed for all actions except “removeAll”.
Now let’s define the onStoreChange() method. Add the following lines of code below the construct() method:
// When data changes in the eventStore, update the map markers accordingly
onStoreChange(event) {
  switch (event.action) {
    case "add":
    case "dataset":
      if (event.action === "dataset") {
        this.removeAllMarkers();
      }
      event.records.forEach((eventRecord) =>
        this.addEventMarker(eventRecord)
      );
      break;
    case "remove":
      event.records.forEach((event) => this.removeEventMarker(event));
      break;
    case "update": {
      const eventRecord = event.record;
      this.removeEventMarker(eventRecord);
      this.addEventMarker(eventRecord);
      break;
    }
    case "filter": {
      const renderedMarkers = [];
      this.eventStore
        .query((rec) => rec.marker, true)
        .forEach((eventRecord) => {
          if (!event.records.includes(eventRecord)) {
            this.removeEventMarker(eventRecord);
          } else {
            renderedMarkers.push(eventRecord);
          }
        });
      event.records.forEach((eventRecord) => {
        if (!renderedMarkers.includes(eventRecord)) {
          this.addEventMarker(eventRecord);
        }
      });
      break;
    }
  }
}
This method updates the map markers when the work tasks event store changes. The "dataset" action occurs when the event store is populated with our initial work events from the data.json file.
Now we’ll define the addEventMarker(), removeEventMarker(), and removeAllMarkers() methods below the onStoreChange() method. Add the following addEventMarker() function definition:
// Puts a marker on the map if it has lat/lon specified + the timespan intersects the time axis
addEventMarker(eventRecord) {
  if (!eventRecord.address) return;

  const { lat, lon } = eventRecord.address;
  if (lat && lon && this.timeAxis.isTimeSpanInAxis(eventRecord)) {
    const color =
        eventRecord.eventColor ||
        eventRecord.resource?.eventColor ||
        "#f0f0f0",
      marker = new mapboxgl.Marker({
        color,
      })
        .setLngLat([lon, lat])
        .addTo(this.map);
    marker.getElement().id = eventRecord.id;
    eventRecord.marker = marker;
    marker.eventRecord = eventRecord;
    marker.addTo(this.map);
  }
}
This function gets the event’s latitude and longitude coordinates from the event’s "address" property. Each event in our data.json file has an "address" property. Our scheduler resources, which are the workers, have an "eventColor" property that determines the map marker color.
Now add the following removeEventMarker() function definition:
removeEventMarker(eventRecord) {
  const marker = eventRecord.marker;
  if (marker) {
    marker.popup && marker.popup.remove();
    marker.popup = null;
    marker.remove();
  }
  eventRecord.marker = null;
}
This function gets the marker from the eventRecord argument and removes the marker as well as its popup. We’ll add map marker popups later in the tutorial.
Lastly, add the following removeAllMarkers() function definition:
removeAllMarkers() {
  this.eventStore.forEach((eventRecord) =>
    this.removeEventMarker(eventRecord)
  );
}
This function loops through each work task event and calls the removeEventMarker() method for each of them.
You’ll now see map markers of the work task events on your map:
Only show map markers for work task events in currently viewed scheduler time axis
If you change the date on the scheduler to a date with no work task events, map markers for events will be displayed on the map. Let’s make our map markers only display if the work task event is visible in the current scheduler view.
In the construct() method, add the following line of code below the me.eventStore.on("change", me.onStoreChange, me); line:
me.timeAxis.on("reconfigure", me.onTimeAxisReconfigure, me);The scheduler’s time axis reconfigure event fires when the time axis is changed. When this event occurs, we’ll call the onTimeAxisReconfigure() method. Add the following onTimeAxisReconfigure() method below the onStoreChange() method:
// Only show markers for events in currently viewed time axis
onTimeAxisReconfigure() {
  this.eventStore.forEach((eventRecord) => {
    this.removeEventMarker(eventRecord);
    this.addEventMarker(eventRecord);
  });
}
This method removes or adds map markers, depending on which work task events are visible on the scheduler’s time axis.
Now, if you change the date on your scheduler, only the map markers for the current date will be displayed.
Adding popups to the map markers
Let’s add popups to the map markers that show the name of the work task event as well as a shortened name of the address.
Add the following method below the static getter method defaultConfig() in the MapPanel.js file:
composeBody() {
  const result = super.composeBody();
  result.listeners = {
    click: "onMapClick",
    delegate: ".mapboxgl-marker",
  };
  return result;
}
The composeBody() method calls the parent class’s composeBody() method. The parent class is the Panel class. We use the composeBody() method’s returned result to set the click event listener to call the onMapClick method that we’ll soon define. We use the delegate property to delegate the click event to the map markers only, not the whole map.
Below the removeAllMarkers() method, add the following lines of code:
onMapClick({ target }) {
  const markerEl = target.closest(".mapboxgl-marker");
  if (markerEl) {
    const eventRecord = this.eventStore.getById(markerEl.id);
    this.showTooltip(eventRecord);
    this.trigger("markerclick", { marker: eventRecord.marker, eventRecord });
  }
}
When a map marker is clicked, we find the work task event record for the clicked marker by its id. In the addEventMarker() method, we set the map marker’s id to the event record’s id. We then call the showTooltip() method (which we’ll define next) and then call the trigger method that triggers a custom "markerclick" event that we’ll use to scroll the work task event bar in the scheduler into view.
Now add the following showTooltip() method below the onMapClick() method:
showTooltip(eventRecord, centerAtMarker) {
  const me = this,
    marker = eventRecord.marker;
  me.popup && me.popup.remove();
  // if (centerAtMarker) {
  //   me.scrollMarkerIntoView(eventRecord);
  // }
  const popup =
    (me.popup =
    marker.popup =
      new mapboxgl.Popup({
        offset: [0, -21],
      }));
  popup.setLngLat(marker.getLngLat());
  popup.setHTML(
    StringHelper.xss`<span class="event-name">${eventRecord.name}</span><span class="location"><i class="b-fa b-fa-map-marker-alt"></i>${eventRecord.shortAddress}<span>`
  );
  popup.addTo(me.map);
}
This method removes any existing popup and creates a Mapbox popup. We sanitize the HTML set inside of the popup using the Bryntum StringHelper xss() method.
Include an import for the StringHelper in MapPanel.js:
import { Panel, StringHelper } from "@bryntum/schedulerpro";We need to define the shortAddress() method of our custom Task event. In the Task.js file, add the following object to the array returned by the static fields() getter method:
{ name : 'address', defaultValue : {} },Now the address field will be a part of our work tasks’ event store.
Add the following method below the static fields() getter method:
get shortAddress() {
  return (this.address?.display_name || "").split(",")[0];
}
This shortAddress() method returns the first word of the address’s display_name.
Now if you click on a map marker, you’ll see a popup showing the name of the work task event and the shortened address name:

Adding the shortened address to the event bars
We can also customize the event bars in the scheduler to show the shortened address name. In the Schedule.js file, import the StringHelper class:
import { StringHelper } from "@bryntum/schedulerpro";Now add the following custom event renderer below the onNext() method:
eventRenderer({ eventRecord }) {
  return [
    {
      tag: "span",
      className: "event-name",
      html: StringHelper.encodeHtml(eventRecord.name),
    },
    {
      tag: "span",
      className: "location",
      children: [
        eventRecord.shortAddress
          ? {
              tag: "i",
              className: "b-fa b-fa-map-marker-alt",
            }
          : null,
        eventRecord.shortAddress || "⠀",
      ],
    },
  ];
}
This custom eventRenderer displays the work task event, location icon, and the shortened address name on the event taskbar:

Scrolling map markers into view when an event task bar is clicked
Let’s sync the map and scheduler better so that when you click on a work event task bar, the event’s map marker scrolls into view. Add the following method in the MapPanel.js file, below the removeAllMarkers() method:
scrollMarkerIntoView(eventRecord) {
  const marker = eventRecord.marker;
  this.map.easeTo({
    center: marker.getLngLat(),
  });
}
This method moves the map so that the marker for the event passed in is centered on the map. The Mapbox GL JS library’s easeTo() method is used to animate the map’s positioning movement.
We’ll call the scrollMarkerIntoView() method in the showTooltip() method. Uncomment out the following lines of code:
// if (centerAtMarker) {
//   me.scrollMarkerIntoView(eventRecord);
// }
Now we’ll add an event listener to the scheduler so that when an event taskbar is clicked, the map marker scrolls into view. Add the following listeners property to the schedule Scheduler Pro config in the main.js file:
listeners: {
  eventClick: ({ eventRecord }) => {
    // When an event bar is clicked, bring the marker into view and show a tooltip
    if (eventRecord.marker) {
      mapPanel?.showTooltip(eventRecord, true);
    }
  },
  afterEventSave: ({ eventRecord }) => {
    if (eventRecord.marker) {
      mapPanel?.scrollMarkerIntoView(eventRecord);
    }
  },
},
When an event bar is clicked, we call the showTooltip() method of our map panel, which calls the scrollMarkerIntoView() method. We also scroll the map marker into view after an event is saved.
Now if you click on an event task bar, the map marker for it will scroll into view and be at the center of the map.
Scrolling event task bars into view when a map marker is clicked
To make the event task bar scroll into view when a map marker is clicked, add the following listeners property to the mapPanel config in the main.js file:
listeners: {
  // When a map marker is clicked, scroll the event bar into view and highlight it
  markerclick: async ({ eventRecord }) => {
    await schedule.scrollEventIntoView(eventRecord, {
      animate: true,
      highlight: true,
    });
    schedule.selectedEvents = [eventRecord];
  },
},
When the custom markerclick event occurs, triggered by the onMapClick() method in the MapPanel.js file, we call the scrollEventIntoView() method to scroll the event into the viewport.
Now if you click on a map marker, the event taskbar for the event will scroll into view.
Adding an address field dropdown input that searches for location data from the OpenStreetMap API.
We can currently view the addresses of the events from the initial data in the data.json file, but there is no input in the task editor for the address so we can’t change addresses or add an address for a newly created event. Let’s add a custom address input in the task editor to fix this.
First, we’ll create a custom Address model. Create a new file called Address.js in the lib folder and add the following lines of code to it:
import { Model } from "@bryntum/schedulerpro";
// The data model for a task address
export default class Address extends Model {
  static get fields() {
    return ["display_name", "lat", "lon"];
  }
}
We create a custom Model to define the data fields of the custom Address field that we’ll add to the task editor.
Create another new file called AddressSearchField.js in the lib folder and add the following lines of code to it:
import { Combo } from "@bryntum/schedulerpro";
import Address from "./Address.js";
// A custom remote-search field, querying OpenStreetMap for addresses.
export default class AddressSearchField extends Combo {
  // Factoryable type name
  static get type() {
    return "addresssearchfield";
  }
  static get $name() {
    return "AddressSearchField";
  }
  static get configurable() {
    return {
      clearable: true,
      displayField: "display_name",
      // Setting the value field to null indicates we want the Combo to get/set address *records* as opposed to the
      // id of an address record.
      valueField: null,
      keyStrokeFilterDelay: 1000,
      minChars: 8,
      store: {
        modelClass: Address,
        readUrl: "https://nominatim.openstreetmap.org/?format=json&q=",
        restfulFilter: true,
        fetchOptions: {
          // Please see MDN for fetch options: https://developer.mozilla.org/en-US/docs/Web/API/WindowOrWorkerGlobalScope/fetch
          credentials: "omit",
        },
      },
      // Addresses can be long
      pickerWidth: 450,
      validateFilter: false,
      listCls: "address-results",
      // Custom list item template to show a map icon with lat + lon
      listItemTpl: (address) => `<i class="b-fa b-fa-map-marker-alt"></i>
                <div class="address-container">
                    <span class="address-name">${address.display_name}</span>
                    <span class="lat-long">${address.lat}°, ${address.lon}°</span>
                </div>
            `,
    };
  }
}
AddressSearchField.initClass();
This custom AddressSearchField is a customized Combo (dropdown) widget that uses the Nominatim API to query for location data by address. The keyStrokeFilterDelay property is for debouncing the API call for address location data. The minChars property is the minimum string length that triggers filtering. You can change these property values as needed.
There are custom CSS classes applied for styling the address field that are defined in style.css. The listCls property is used for styling the returned address results that you can select from. The listItemTpl is the template string used to render each list item of the returned address results.
We need to add this custom address-search field to our scheduler task editor. In Schedule.js, import the AddressSearchField.js file:
import "./AddressSearchField.js";In the defaultConfig() static getter method, add the following address field to the taskEdit items generalTab, below the resourcesField:
addressField: {
  type: "addresssearchfield",
  label: "Address",
  name: "address",
  weight: 100,
},
The weight property determines the order of the fields in the task editor. We set it to 100 so that it will be displayed below the nameField. You can see a table of the weights of the default fields in the general tab of the task editor here.
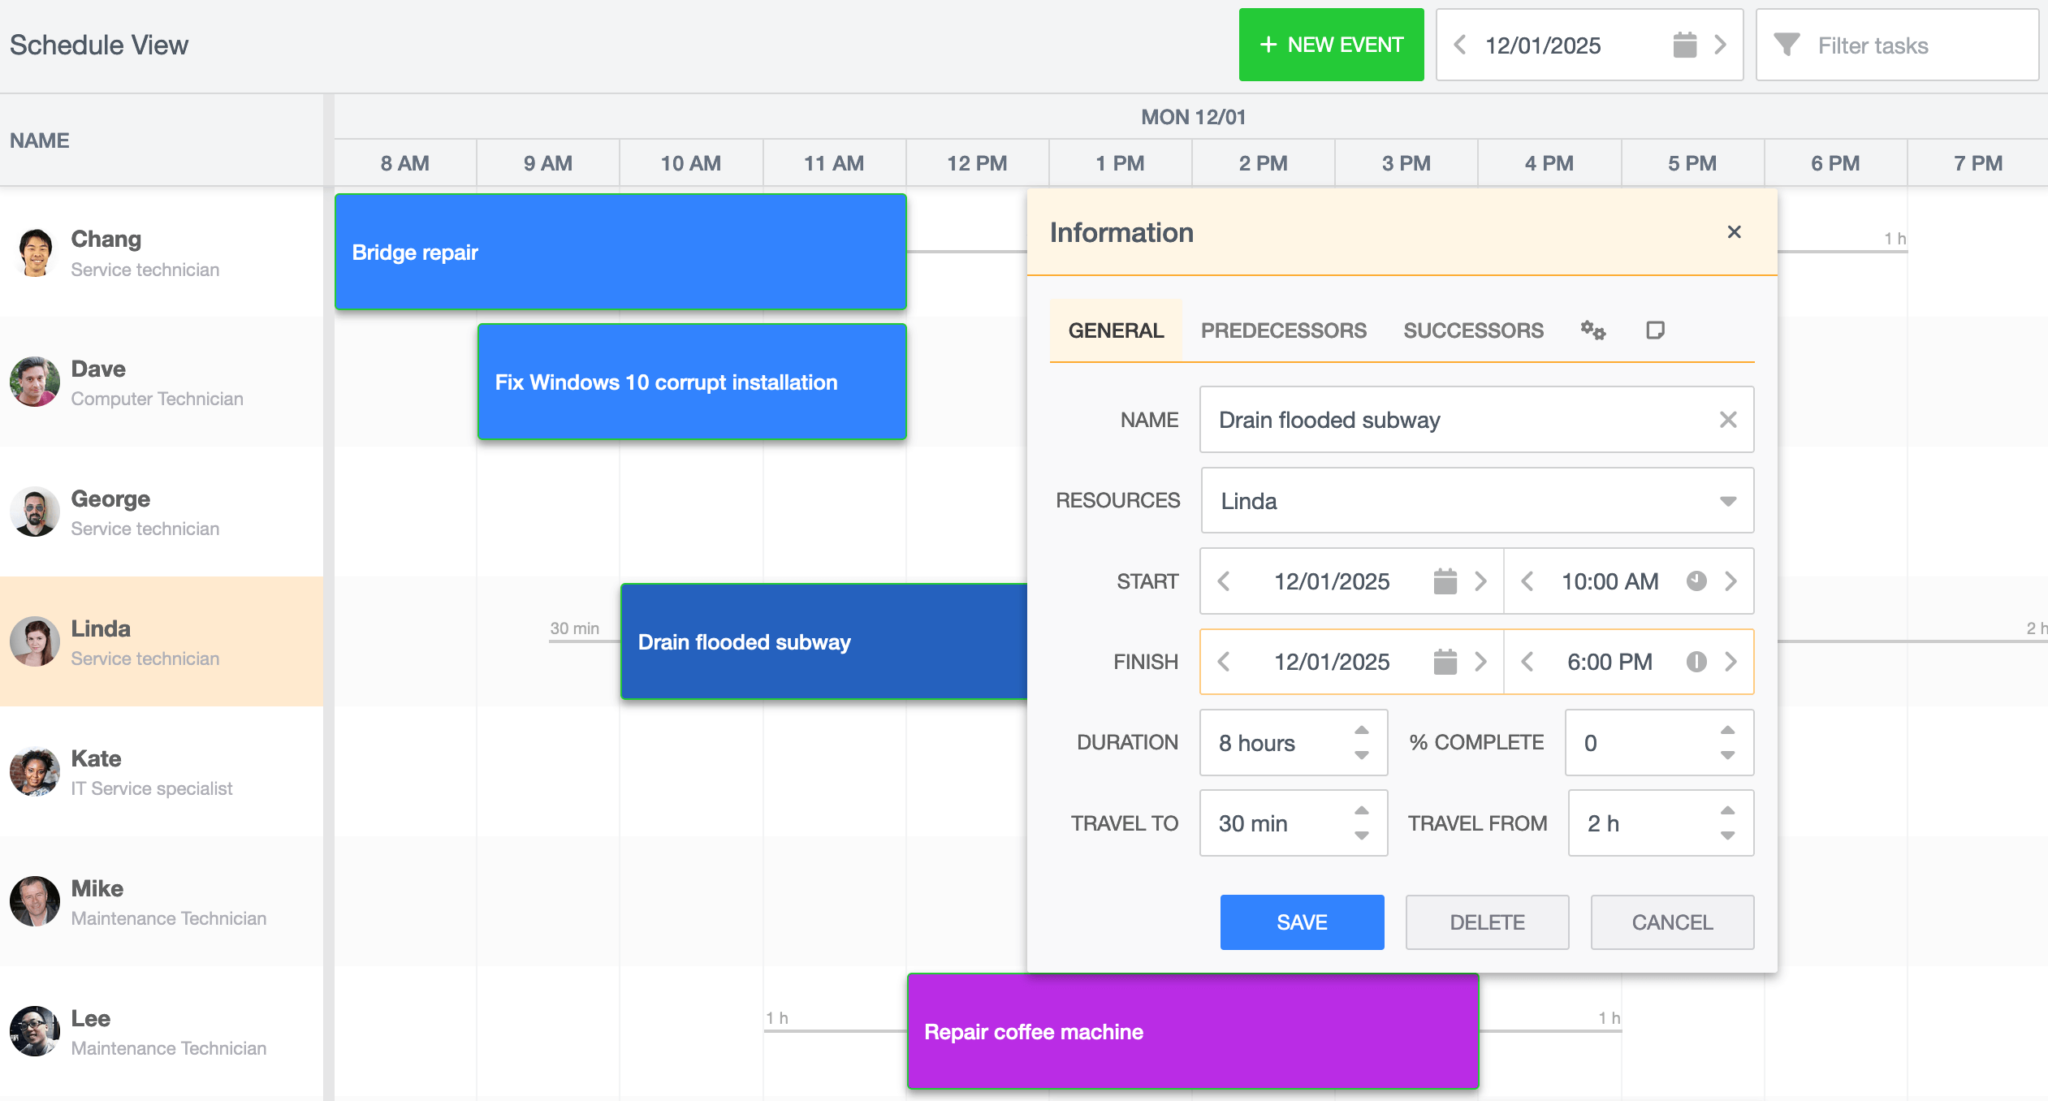
Now, your task editor will have an address field that you can use to add or edit the address of a work task event:
Next steps
This tutorial covered the basics of adding a Mapbox map to a location-based scheduler. If you haven’t already, browse through the Mapbox GL JS library documentation to see what map customizations are possible. For example, you can create a custom map style using Mapbox Studio.
Take a look at the code of the Scheduler Pro Map integration demo that this tutorial is based on to see how you can add light mode and dark mode to your scheduler and map.