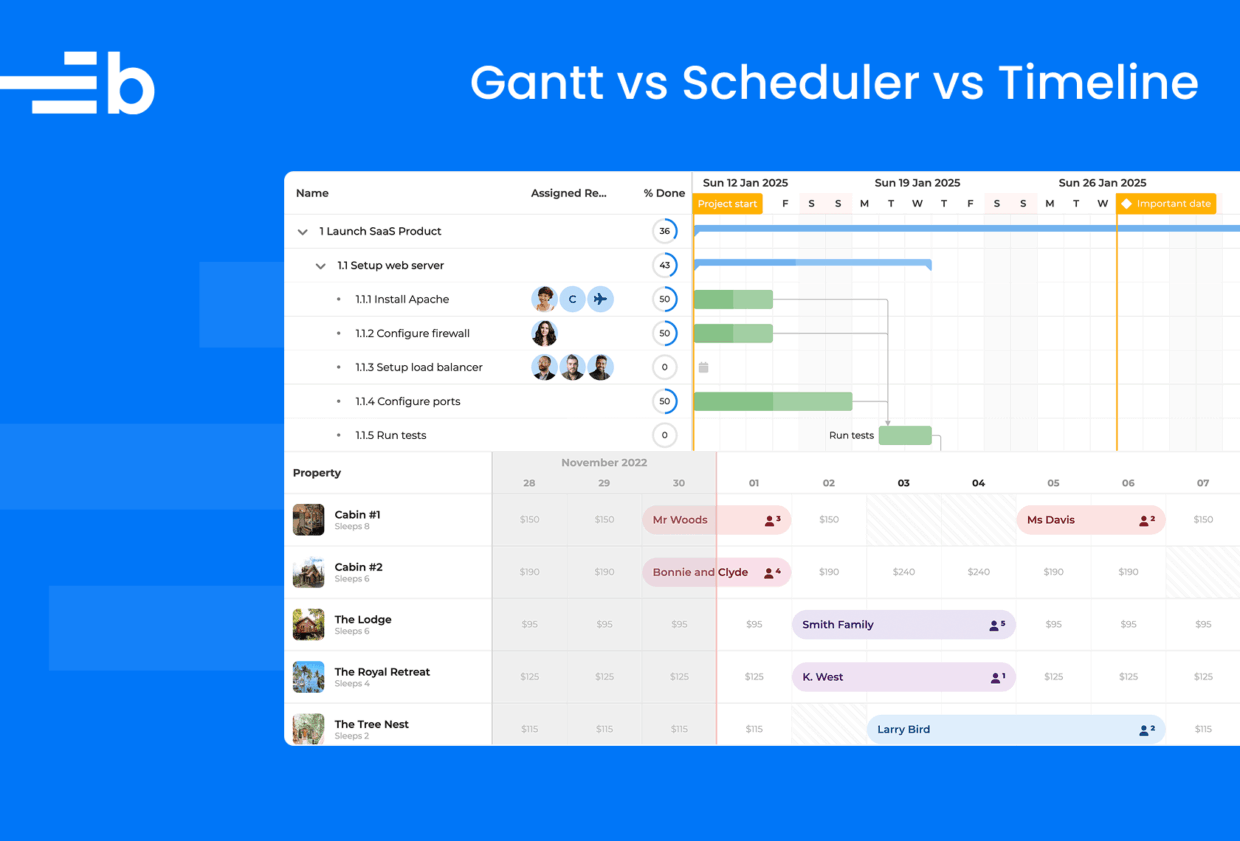
JavaScript project management tools: Gantt vs Scheduler vs Timeline
We strive to keep posts updated, but code samples may sometimes be outdated. Humans, see the Bryntum documentation; agents, https://mcp.bryntum.com for the latest info.
The terminology for Gantt charts, schedulers, and timelines can be confusing due to inconsistent naming by JavaScript libraries and software platforms. In this article, we’ll untangle these terms, from basic timeline components to advanced Gantt charts, to help you understand the differences between them and choose the best one for your project.
Scheduler vs Calendar
A scheduler component is used to schedule events or tasks that are assigned to a resource such as a person, location, or company (for example, bookings for meeting rooms or employee shift planning). A scheduler typically displays the resources in a column on the left and event bars on a timeline to the right, as shown in this Bryntum Scheduler component:
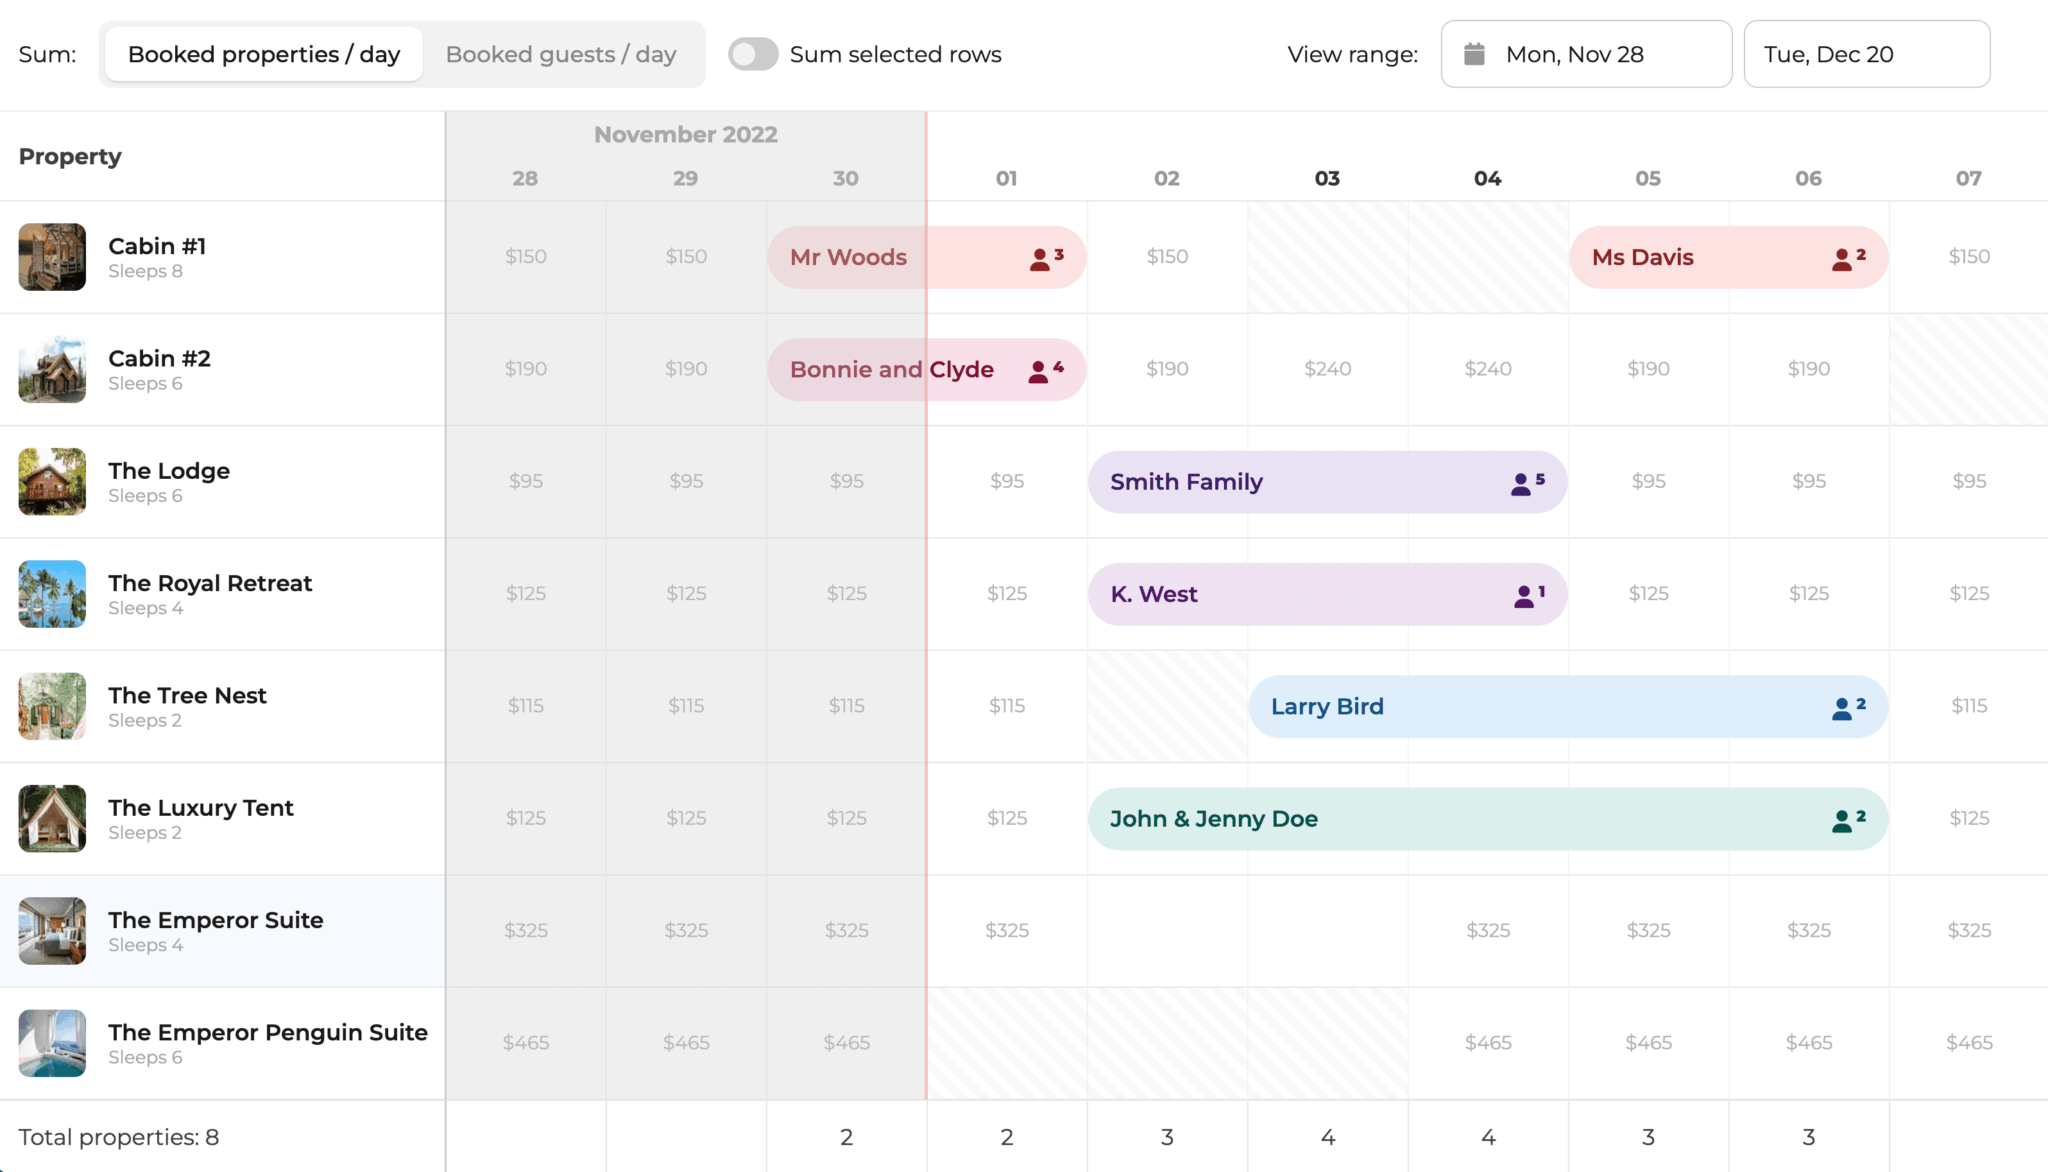
Users can drag and drop, edit, delete, resize, and add events directly in the interface.
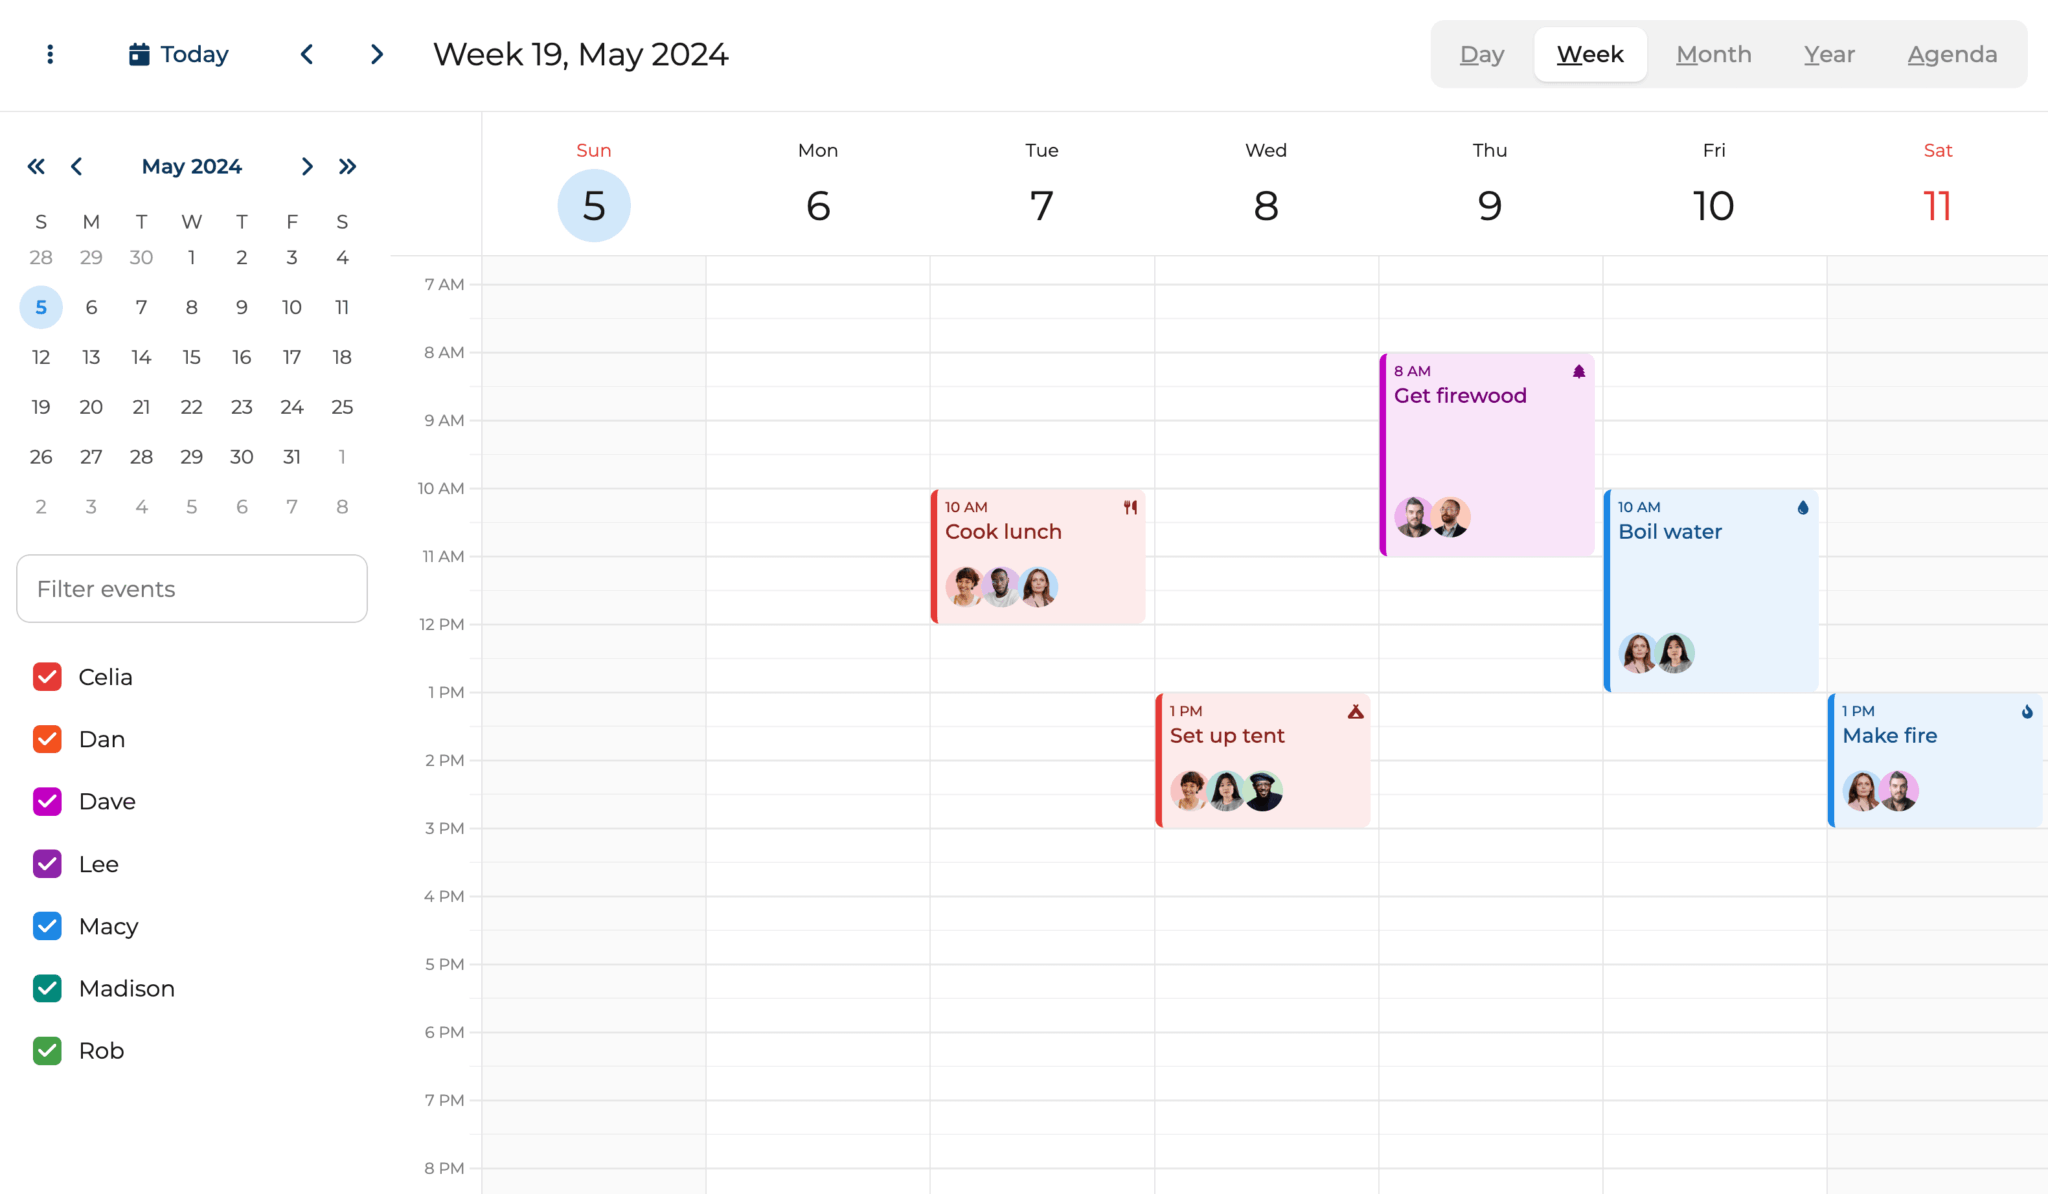
A calendar component, like a scheduler, displays events, tasks, or appointments on a timeline. It typically has different view options such as the Day, Week, Month, Year, and Agenda views. Bryntum Calendar supports over ten views to meet a variety of needs.
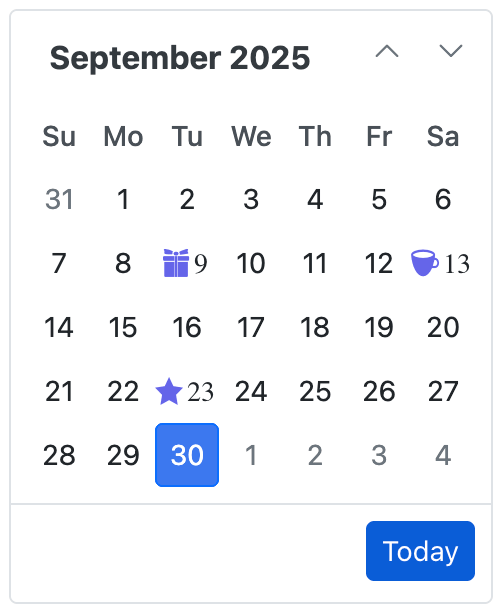
This is a basic Bryntum Calendar component, which resembles a Google Calendar:
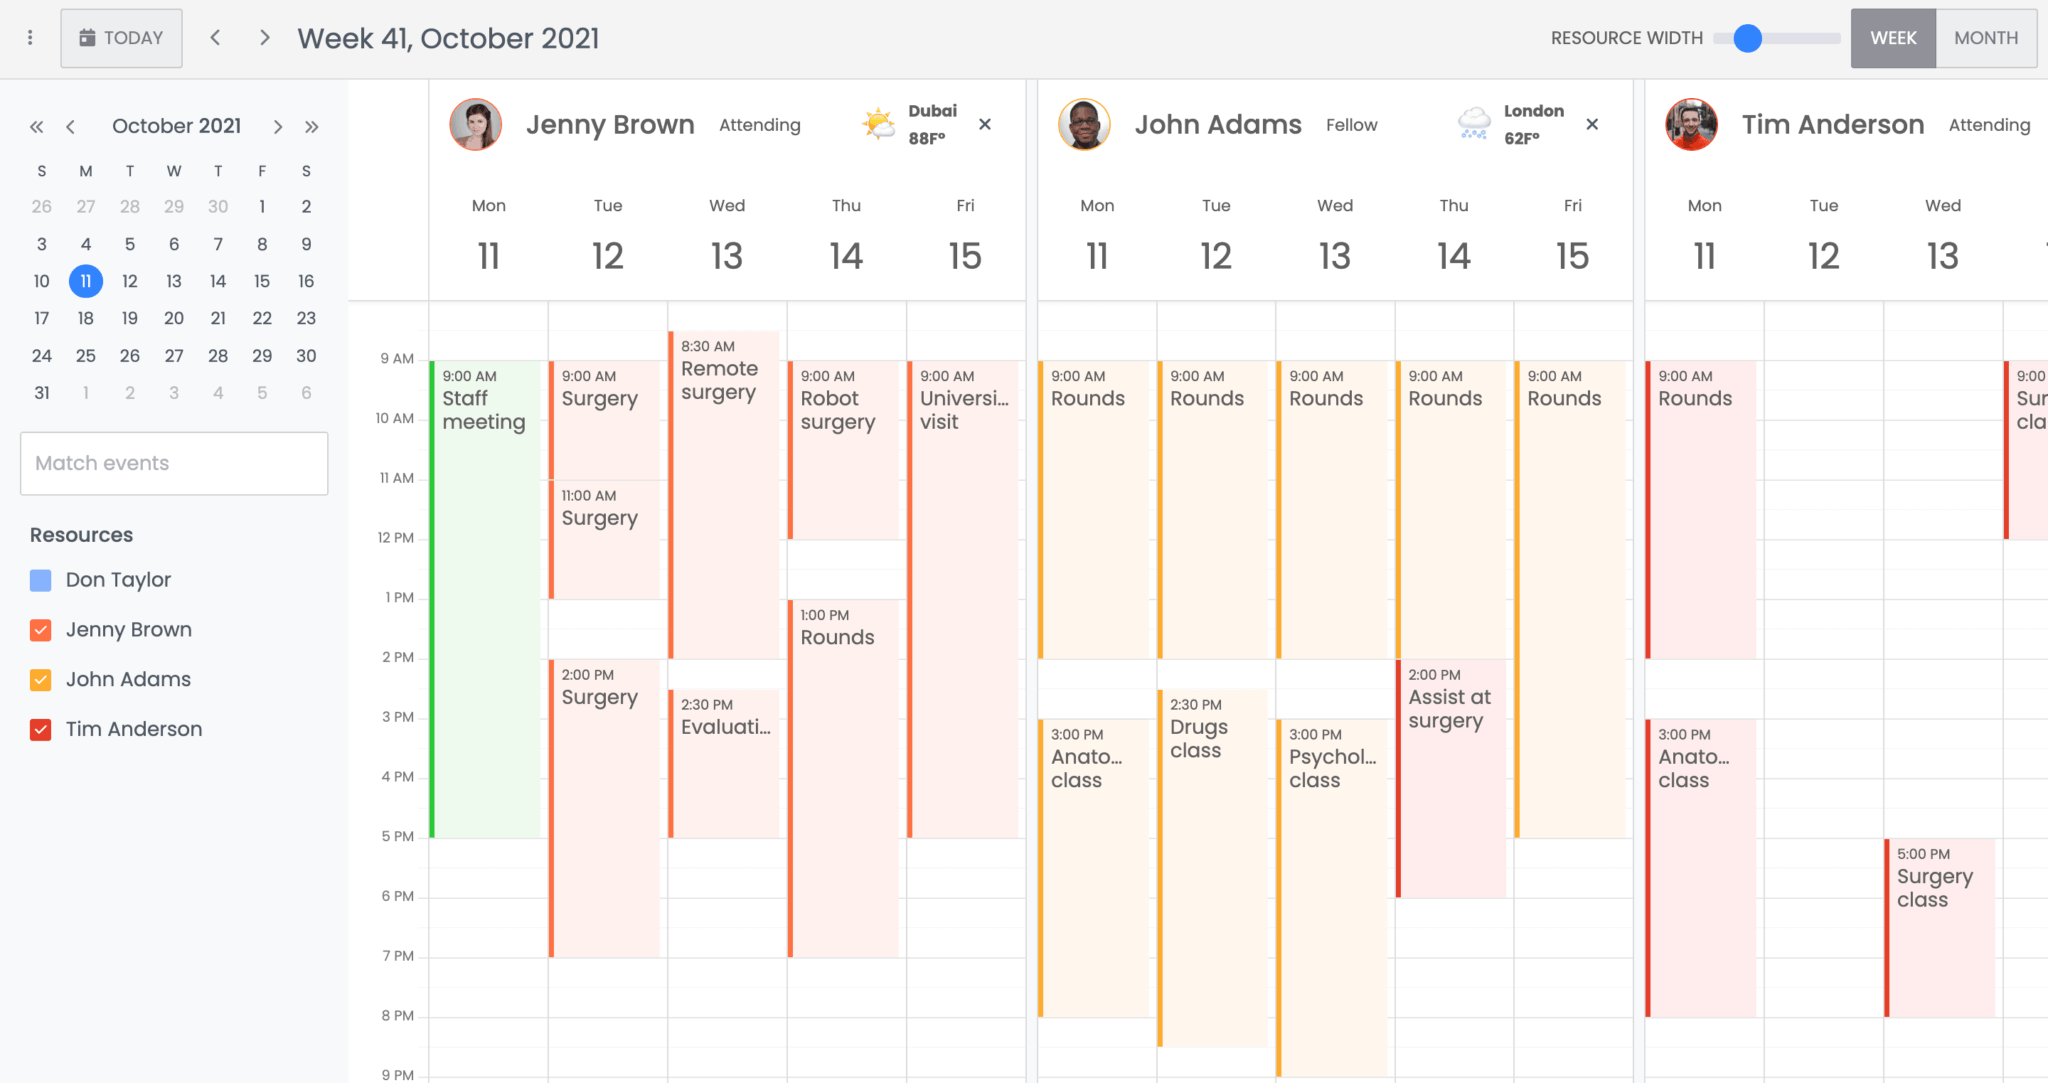
Calendars typically don’t have a resource column, but they may have a resources view where events are grouped by resource vertically or horizontally, like in this Bryntum Calendar:
This blurs the line between a scheduler and a calendar. What distinguishes a scheduler from a calendar is that a scheduler can have dependencies between events, where one event must start after another event ends.
Another difference is that schedulers may have a scheduling engine with advanced scheduling features such as constraints and conflict handling for dealing with complex scheduling scenarios. For instance, the Bryntum Scheduler Pro and DHTMLX Scheduler Pro use a scheduling engine.
JavaScript libraries are inconsistent in their naming of these components.
DHTMLX refers to the scheduler as a scheduling calendar. The Bryntum Scheduler and DayPilot Scheduler use the term “scheduler” for a component with resources in a column on the left and event bars on a timeline on the right. DHTMLX and Syncfusion call it a Scheduler with a timeline view, while Mobiscroll calls the same component an Event Calendar with a timeline view.
DHTMLX also has an Event Calendar, which is similar to the DHTMLX Scheduler but smaller with fewer features, designed for creating Google-like calendars. In the DHTMLX Scheduler and Syncfusion JavaScript Scheduler, the scheduler is a timeline view of a scheduling calendar. This is the equivalent of the Bryntum Calendar, which can have a scheduler added in a timeline view. Alternatively, Syncfusion has a date-picker calendar component for forms:
All this ambiguity means that when evaluating libraries, we should focus on the features and visual layout rather than the product name. A “scheduler” in one library might be called a “calendar with timeline view” in another, even though they provide similar functionality.
Scheduler vs Gantt
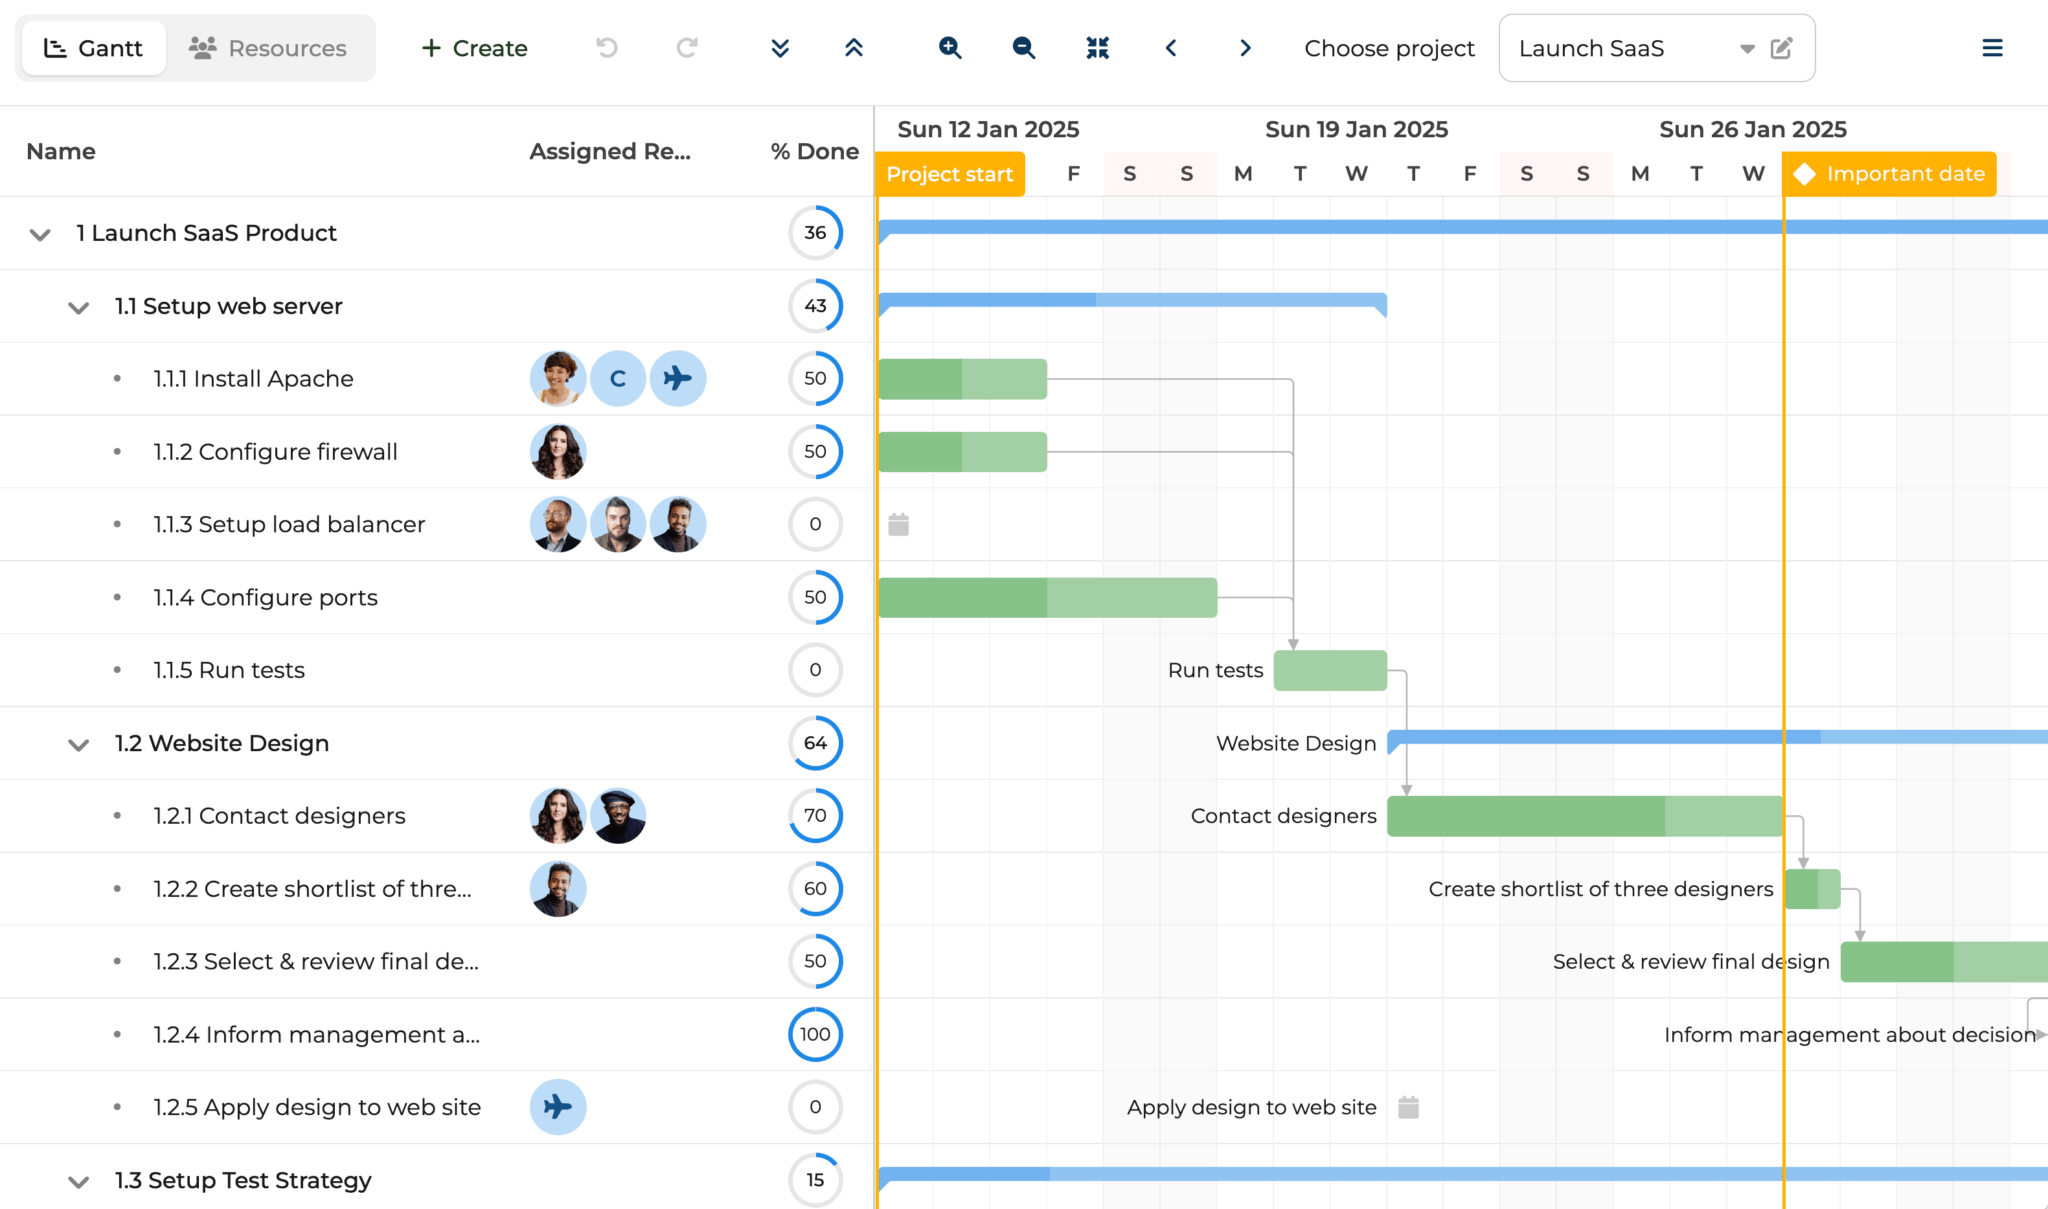
A Gantt chart is a project planning and management tool for visualizing tasks for a project. It has task details in columns on the left and a timeline with task bars on the right that show the order in which tasks must be completed, when they’re due, their progress, and their duration. Gantt charts can display task dependencies, milestones, and resource allocation.
The key features that differentiate a Gantt chart from a scheduler are:
- Progress tracking: It can show the completion progress of events, not just time block allocations.
- Longer durations: It typically spans weeks, months, or years rather than hours or days.
- Project visualization: It’s designed to visualize project timelines, break down big projects into smaller tasks, and track task progress over time.
A Gantt chart may have project tracking features such as visualizing the rate of progress with an S-curve or critical path analysis, which represents the chain of linked tasks that directly affects the project finish date.
For simpler project management needs, online Gantt tools like GanttPro and monday.com Gantt offer no-code convenience and features like real-time collaboration. However, these cloud-based solutions lack the customization and integration capabilities of JavaScript libraries. For example, you won’t be able to add a custom-styled monday.com Gantt to a web app or to another platform such as a Salesforce dashboard. This is possible with Bryntum Gantt, which we cover in our blog post: Using Bryntum Gantt as a Salesforce Lightning web component.
Gantt vs timeline
A Gantt chart is essentially a timeline plus advanced features like critical path analysis, resource allocation, dependencies, milestones, and progress tracking for sequential tasks. It adds an extra dimension to a timeline by including a vertical axis with ordered tasks.
The features unique to Gantt charts compared to timelines are:
- Two-dimensional layout: They have a vertical axis with tasks.
- Dependencies between tasks: They can show dependencies between tasks that show the order in which tasks must be completed.
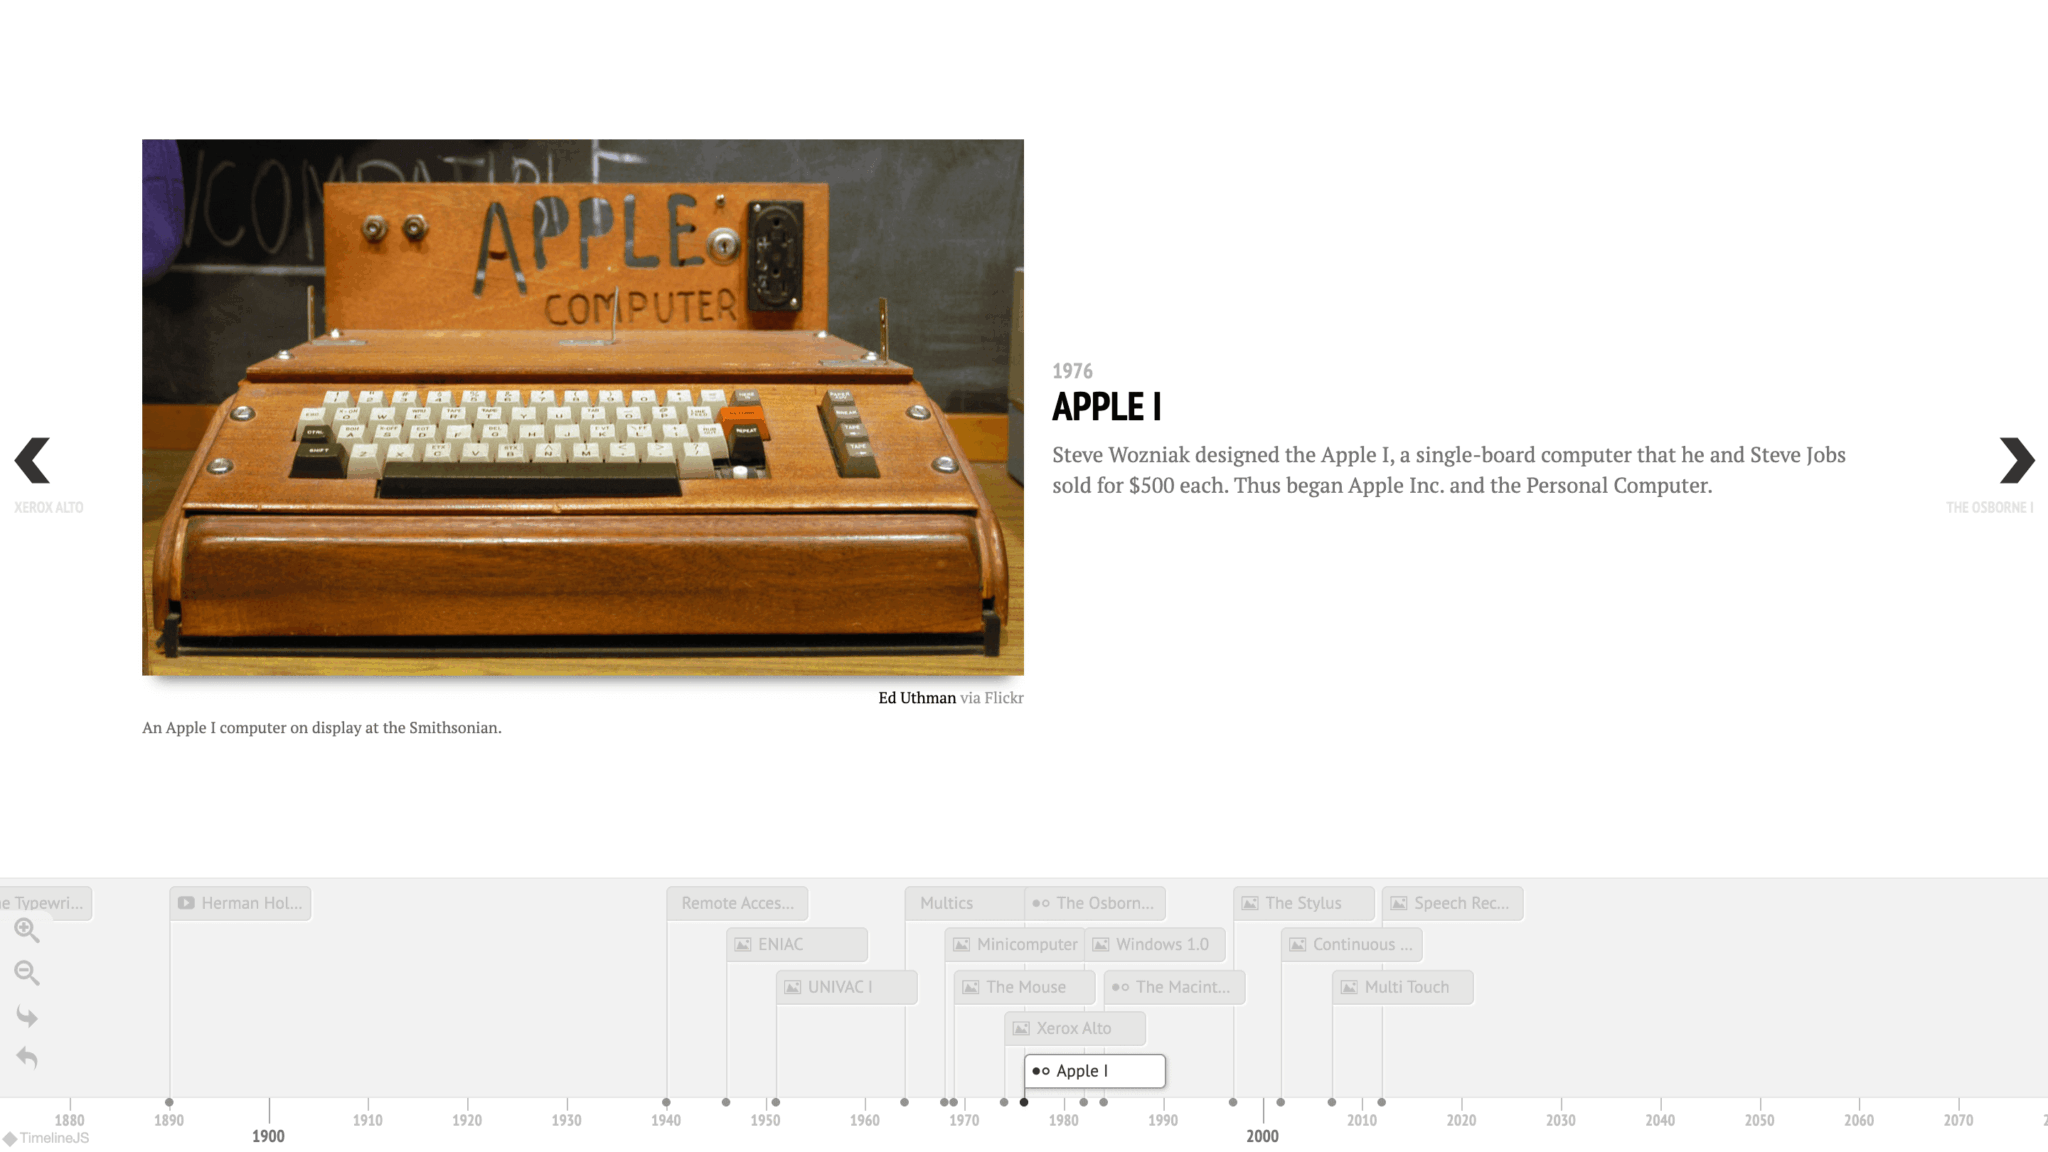
Timelines are typically simpler than Gantt charts and are used for basic project planning and visualization, education, or storytelling. For example, TimelineJS is a timeline tool for journalism and storytelling and can be used with no code and Google Sheets or code as needed.
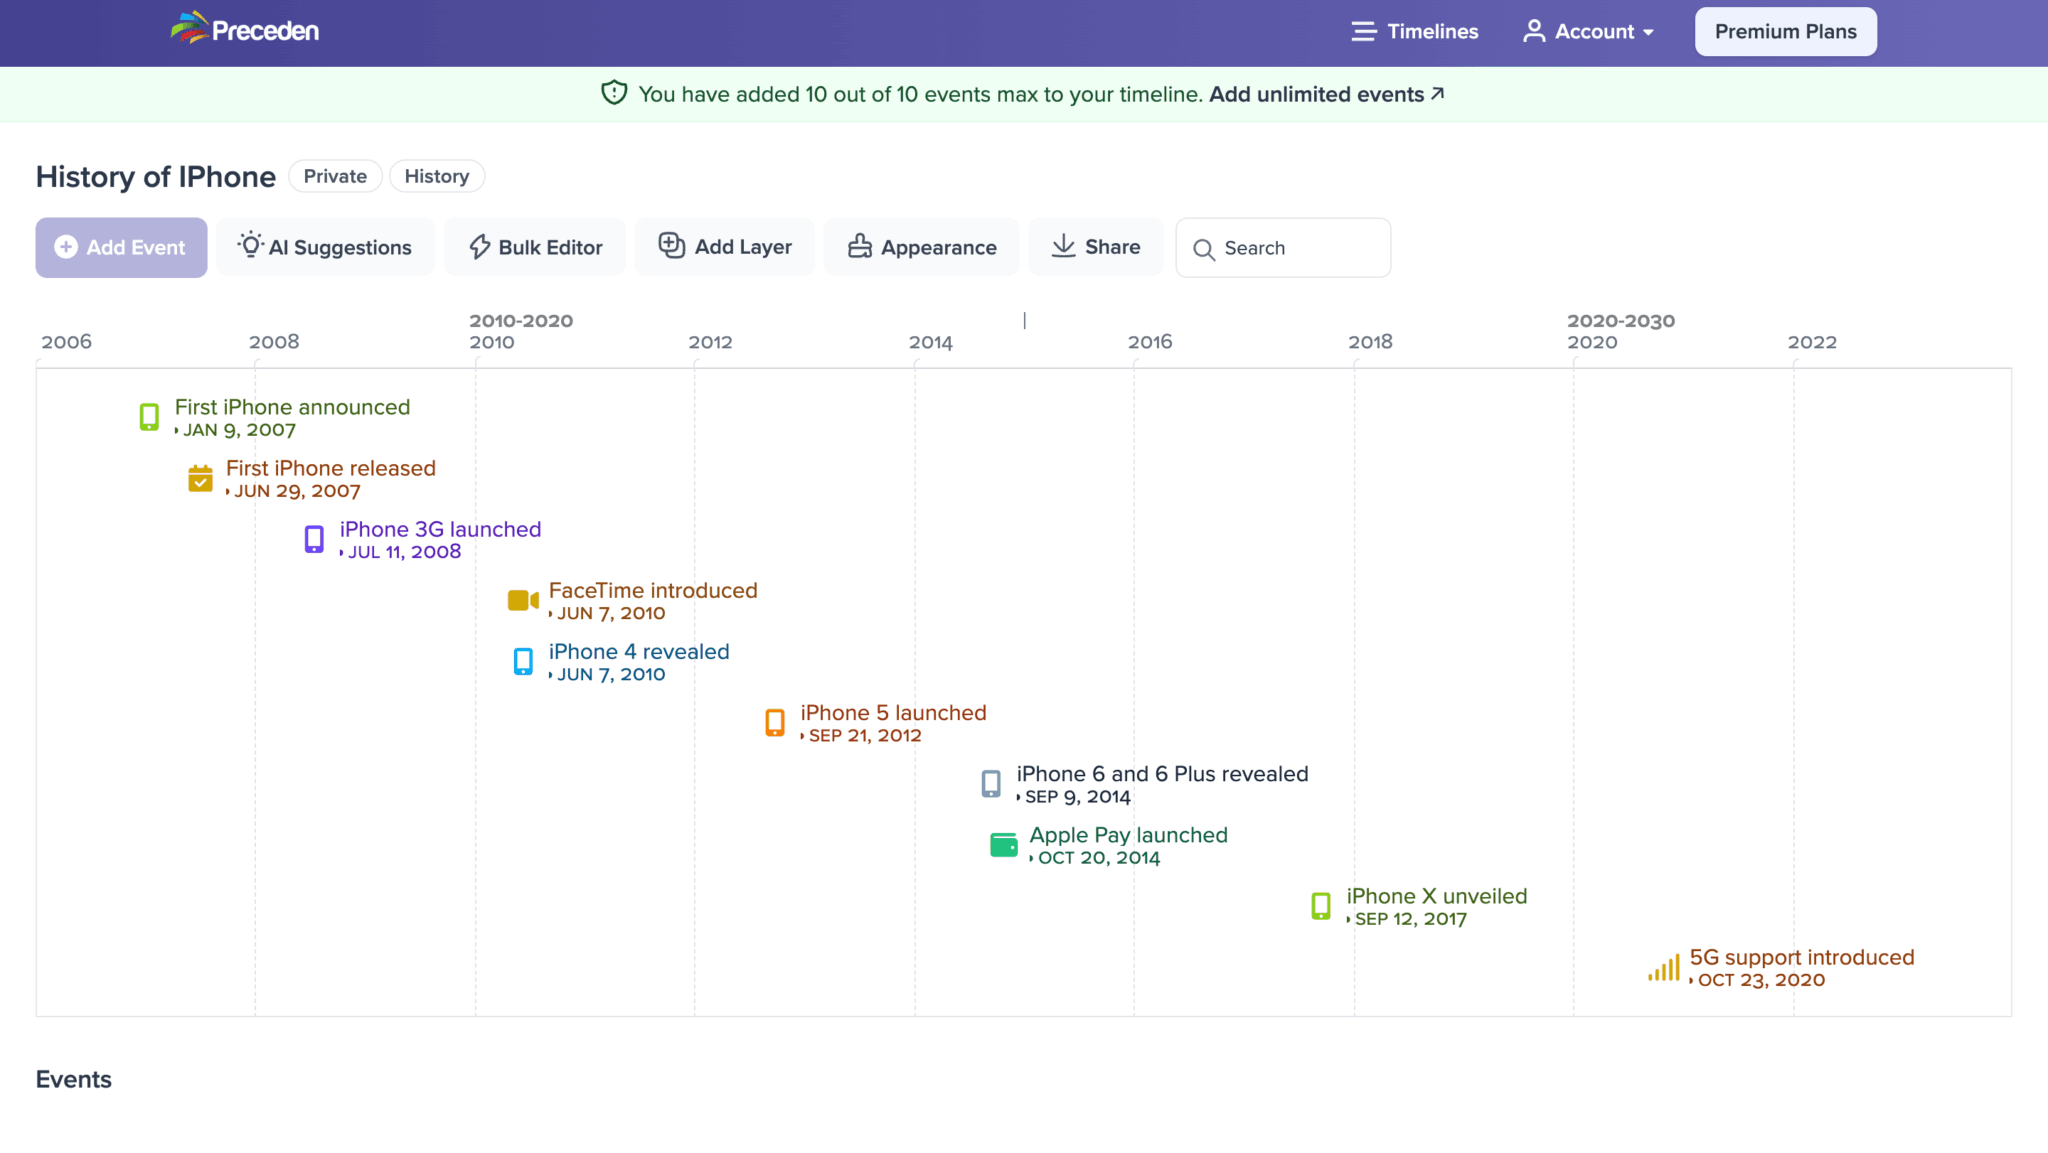
They can also be more advanced. For example, Preceden is a no-code timeline tool for project management, storytelling, and education. It can have dependencies between tasks and be used as a basic scheduler or Gantt chart. This is useful for creating timelines for historical events, which Preceden can generate using AI:
However, these timeline tools have restricted styling and modification options and lack advanced features such as critical path analysis.
Which one should you use?
| Use case | Project management tool | Examples |
|---|---|---|
| Appointment and resource management | Scheduler | Property bookings, hospital appointments, and shift scheduling |
| Complex project management and progress tracking | Gantt chart | Software development, construction, and marketing campaigns |
| Simple project management | Timeline | Basic task tracking |
| Educational content | Timeline | History timelines and storytelling aids |
| Research timelines and event documentation | Timeline | Academic research milestones and law case study chronologies |
| Comprehensive project and resource coordination | Scheduler, Gantt, and Calendar | Construction crew scheduling with task dependencies and project timelines, renewable energy infrastructure planning, and power production scheduling across facilities |
Choosing the right tool comes down to the complexity of your needs: Use a timeline for a simple chronological display, a scheduler for resource-based event management, and a Gantt chart for project management with dependencies and progress tracking. Use a combination of tools for comprehensive resource coordination.