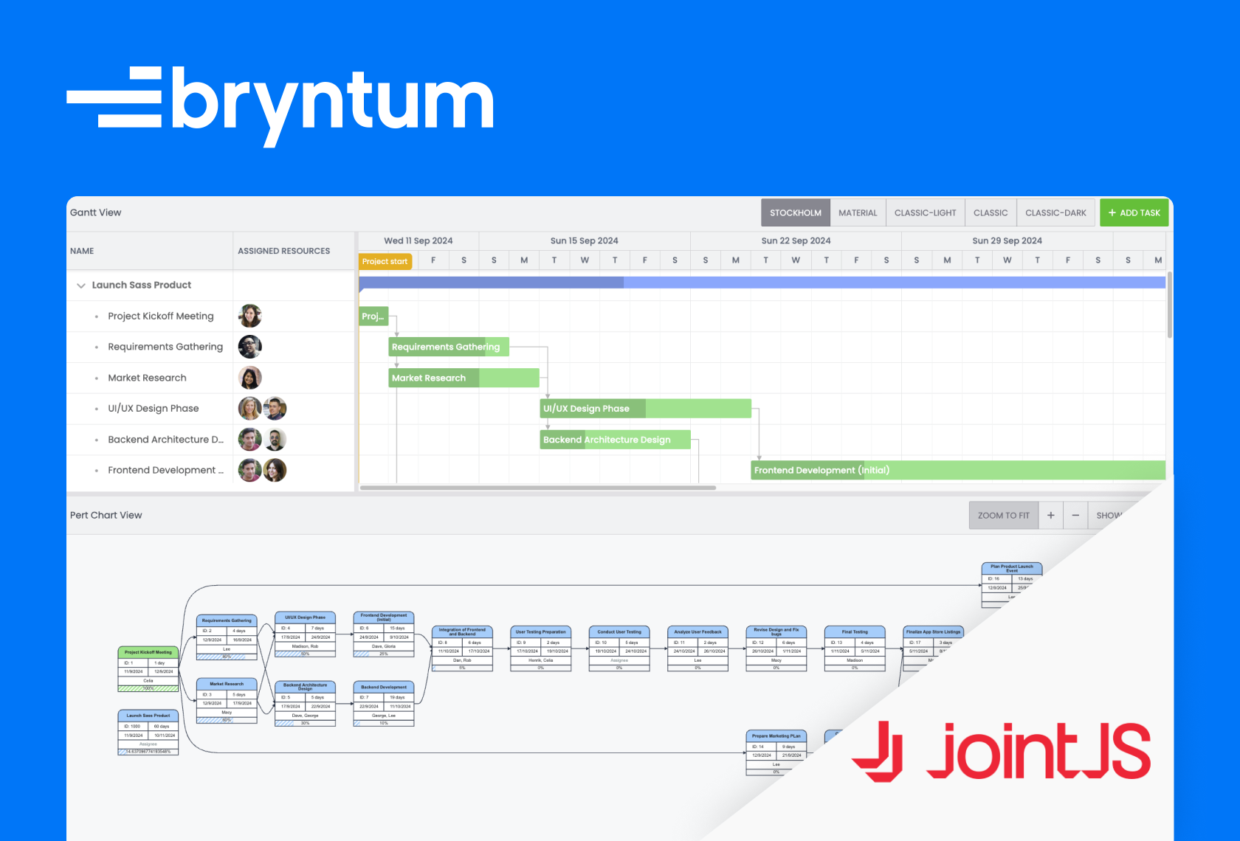
Integrating Bryntum Gantt with JointJS (PERT Chart)
We strive to keep posts updated, but code samples may sometimes be outdated. Humans, see the Bryntum documentation; agents, https://mcp.bryntum.com for the latest info.
Project management requires detailed scheduling and high-level visualization of task dependencies. While Gantt charts excel at showing task timelines, program evaluation and review technique (PERT) charts offer a clear view of task sequences and dependencies. By integrating Bryntum Gantt, a powerful scheduling component, with JointJS, a flexible diagramming library, we can create an interactive PERT chart that enhances project visualization.
In this article, you’ll learn how to:
- Create a simple Gantt chart.
- Use JointJS to generate a PERT chart dynamically.
- Synchronize data between the two components.
When you’re done, you’ll have functional Gantt and PERT charts synchronized.
Bryntum Gantt and JointJS are premium libraries, but both offer free trials you can sign up for if you don’t have a license. Bryntum offers a 45-day free trial, while JointJS offers 30.
Getting started
Clone the starter GitHub repository. This starter repository uses the development server and JavaScript bundler Vite. You’ll need Node.js version 14.18+ installed for Vite to work.
Install the Vite dev dependency by running the following command:
npm installRun the local dev server using npm run dev and you’ll see a blank page.
Creating a Gantt chart using Bryntum Gantt
We’ll install the Bryntum Gantt component using npm.
Use the guide to using the Bryntum npm repository to log in to the Bryntum component registry.
Then, install Bryntum Gantt by following step four of the guide to getting started with Bryntum Gantt.
Let’s import the Bryntum Gantt component and give it some basic configuration. In the main.js file, add the following lines:
import { DomHelper, Gantt, StringHelper } from '@bryntum/gantt';
import './style.scss';
const gantt = new Gantt({
appendTo : 'app',
dependencyIdField : 'sequenceNumber',
rowHeight : 45,
tickSize : 45,
barMargin : 8,
autoAdjustTimeAxis : false,
resourceImageFolderPath : 'users/',
project : {
autoSetConstraints : true,
autoLoad : true,
// slightly simple example with dependencies
loadUrl : 'data.json'
},
columns : [
{ type : 'name', width : 250 },
{
type : 'resourceassignment',
width : 180,
showAvatars : true,
editor : {
picker : {
// path to images need to be set in picker directly
resourceImagePath : 'users/',
selectionMode : {
// enable single selection in a picker assignmentGrid
multiSelect : true,
showCheckAll : true
}
}
}
}
],
// Custom task content, display task name on child tasks
taskRenderer({ taskRecord }) {
if (taskRecord.isLeaf && !taskRecord.isMilestone) {
return StringHelper.encodeHtml(taskRecord.name);
}
}
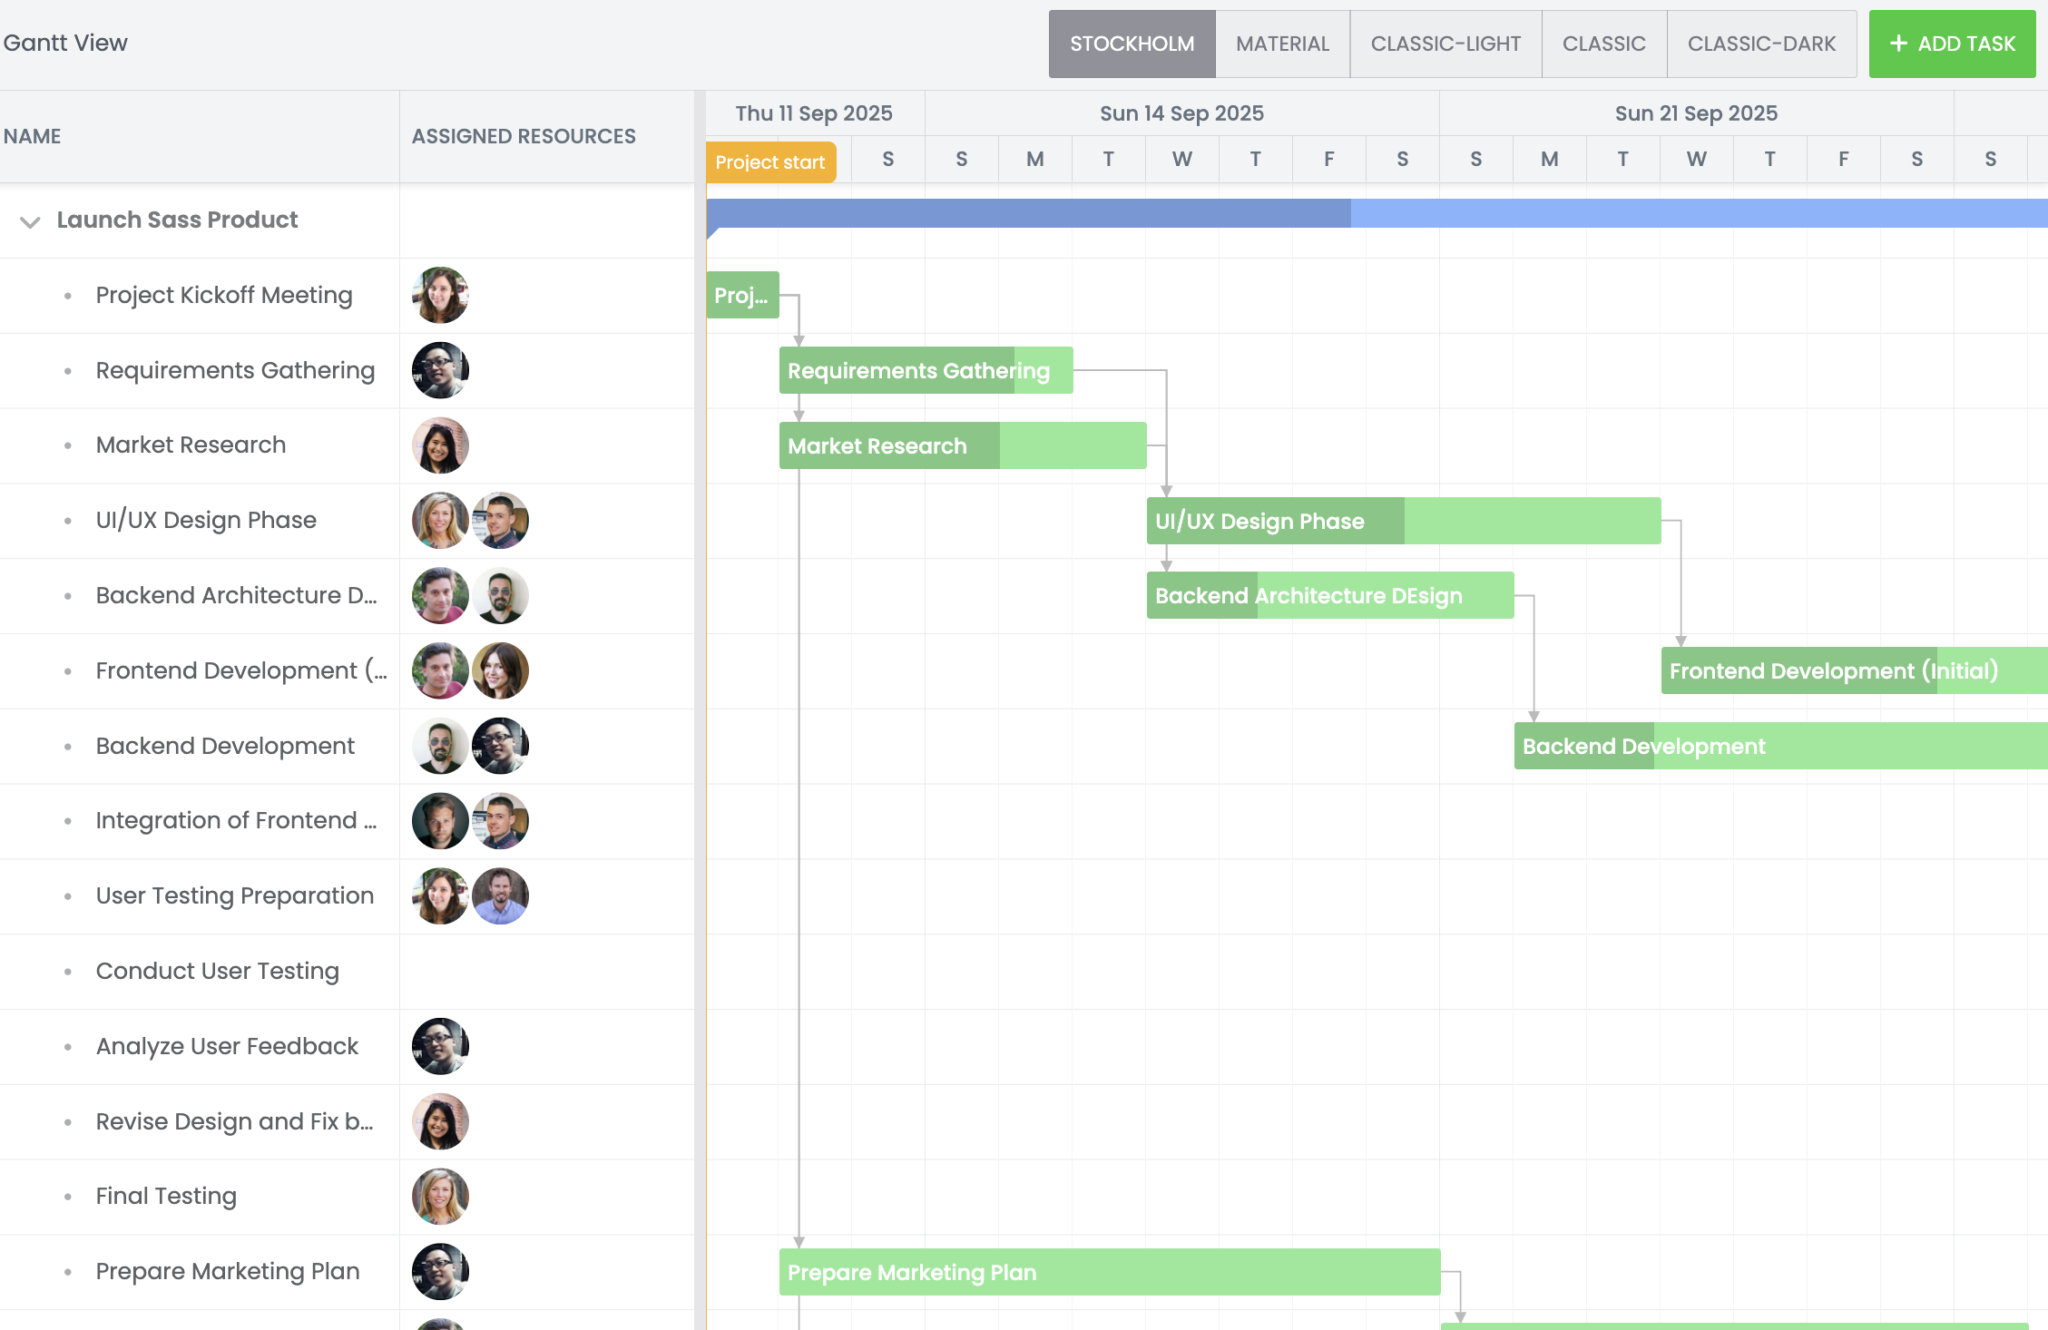
});Add a toolbar to the Gantt with theme buttons. We will add the functionality later.
    // Toolbar buttons
    tbar : {
        items : [
            {
                ref  : 'title',
                type : 'widget',
                cls  : 'widget-title',
                html : 'Gantt View',
                flex : 1
            },
            {
                ref         : 'theme',
                type        : 'buttonGroup',
                toggleGroup : true,
                items       : ['Stockholm', 'Material', 'Classic-Light', 'Classic', 'Classic-Dark'].map(name => {
                    return {
                        id      : name.toLowerCase(),
                        text    : name,
                        pressed : DomHelper.themeInfo.name === name
                    };
                })
            },
            {
                type    : 'button',
                ref     : 'addTask',
                text    : 'Add Task',
                cls     : 'b-raised',
                icon    : 'b-fa b-fa-plus',
                color   : 'b-green',
                onClick : async () => {
                  const
                      newID   = gantt.project.tasks.length + 1,
                      newTask = {
                          id        : gantt.project.tasks.length + 1,
                          name      : 'New Task',
                          duration  : 1,
                          effort    : 0,
                          startDate : gantt.project.startDate
                      };

                  gantt.project.appendChild(newTask);
                  // wait for immediate commit to calculate new task fields
                  await gantt.project.commitAsync();
                  await gantt.scrollTaskIntoView(newID);
                  gantt.focusCell({ id : newID });
              }
            }
        ]
    },
Add the following to src/style.scss:
@import url('https://fonts.googleapis.com/css2?family=Poppins:wght@300;400;500;600;700&display=swap');
html,
body {
  font-family: "Poppins";
  padding: 0px;
  margin: 0px;
}
.b-gridbase.b-outer {
  height: 50%;
}
#app {
  margin: 0;
  display: flex;
  flex-direction: column;
  height: 100vh;
  font-size: 14px;
}
.b-gridbase.b-outer {
    height : 60%;
}
.b-pertpanel {
    height: 40%;
}
Finally, to style the Bryntum Gantt, add the line below to index.html, after <title></title>:
<link rel="stylesheet"
      href="node_modules/@bryntum/gantt/gantt.stockholm.css"
      data-bryntum-theme
/>
The public directory contains a users/ folder and a data.json file. These elements display resource headshots and populate the Gantt chart with data from data.json.
Setting up JointJS
Next, install JointJS. JointJS offers free and premium versions. Since we’ll be using some premium features, we recommend installing JointJS+. For installation steps, refer to the official documentation.
Once JointJS is installed, create src/lib/PertChart.js and add the following content to it:
import theme from './Theme.js';
import { dia, shapes, util, mvc, ui, g, highlighters } from "@joint/plus";
import { DirectedGraph } from "@joint/layout-directed-graph";
import '@joint/plus/joint-plus.css';
const
    { PaperScroller, Toolbar } = ui,
    { Record, RecordView }     = shapes.standard;

export default class PertChart extends mvc.View {
    preinitialize() {
        this.zoomSettings = {
            padding : 20,
            min     : 0.2,
            max     : 4,
            step    : 0.05
        };
        this.className = 'pert-chart';
        this.style = {
            background : theme.backgroundColor,
            position   : 'relative',
            width      : '100%',
            height     : '100%'
        };
    }
    initialize() {
        const
            me            = this,
            cellNamespace = {
                ...shapes,
                task       : TaskElement,
                taskView   : RecordView,
                dependency : DependencyLink
            },
            graph         = new dia.Graph({}, { cellNamespace }),
            paper         = new dia.Paper({
                width             : 800,
                height            : 800,
                model             : graph,
                cellViewNamespace : cellNamespace,
                overflow          : true,
                interactive       : false,
                async             : true,
                autoFreeze        : true,
                clickThreshold    : 10,
                defaultConnector  : {
                    name : 'straight',
                    args : { cornerType : 'cubic', cornerRadius : 100 }
                }
            }),
            scroller      = new PaperScroller({
                autoResizePaper : true,
                baseWidth       : 1,
                baseHeight      : 1,
                paper,
                cursor          : 'grab',
                padding         : 0,
                inertia         : true,
                contentOptions  : {
                    allowNewOrigin   : 'any',
                    useModelGeometry : true,
                    padding          : 50
                }
            });
        scroller.lock();
        me.el.appendChild(scroller.render().el);
        me.paper = paper;
        me.scroller = scroller;
        me.graph = graph;
        if (me.options.toolbar !== false) {
            me.initializeToolbar();
        }
        else {
            me.toolbar = null;
        }
        me.setStyle();
        me.setListeners();
        const { data, target } = me.options;
        if (target) {
            target.appendChild(me.el);
        }
        else {
            throw new Error('PertChart: Missing target element.');
        }
        // Load initial data, if provided.
        if (data) {
            me.update(data);
            me.zoomToFit();
        }
    }
    initializeToolbar() {
        const
            me           = this,
            { scroller } = this,
            theme        = 'custom',
            toolbar      = new Toolbar({
                theme,
                tools : [
                    {
                        theme,
                        type             : 'zoom-to-fit',
                        name             : 'zoom-to-fit',
                        text             : 'Zoom to Fit',
                        min              : me.zoomSettings.min,
                        max              : me.zoomSettings.max,
                        step             : me.zoomSettings.step,
                        padding          : me.zoomSettings.padding,
                        useModelGeometry : true
                    },
                    {
                        theme,
                        type : 'zoom-in',
                        name : 'zoom-in',
                        text : 'Zoom In',
                        max  : me.zoomSettings.max
                    },
                    {
                        theme,
                        type : 'zoom-out',
                        name : 'zoom-out',
                        text : 'Zoom Out',
                        min  : me.zoomSettings.min
                    }
                ],
                autoToggle : true,
                references : { paperScroller : scroller }
            });
        me.el.appendChild(toolbar.render().el);
        me.toolbar = toolbar;
    }
    showNavigator() {
        const me = this;
        me.hideNavigator();
        const navigator = new ui.Navigator({
            paperScroller  : me.scroller,
            width          : 200,
            height         : 150,
            padding        : 10,
            zoom           : false,
            useContentBBox : true,
            paperOptions   : {
                async       : true,
                autoFreeze  : true,
                elementView : NavigatorElementView,
                viewport    : (view) => view.model.isElement()
            }
        });
        navigator.el.style.position = 'absolute';
        navigator.el.style.right = '10px';
        navigator.el.style.bottom = '10px';
        me.el.appendChild(navigator.render().el);
        me.navigator = navigator;
    }
    hideNavigator() {
        if (!this.navigator) {
            return;
        }
        this.navigator.remove();
        this.navigator = null;
    }
    isNavigatorVisible() {
        return Boolean(this.navigator);
    }
    update(data = []) {
        this.resetCells(this.createCells(data));
        this.layoutCells();
        return this;
    }
    zoom(step) {
        const { scroller } = this;
        scroller.zoom(step, {
            min : this.zoomSettings.min,
            max : this.zoomSettings.max
        });
    }
    zoomIn(step = 0.2) {
        this.zoom(step);
    }
    zoomOut(step = 0.2) {
        this.zoom(-step);
    }
    zoomToFit() {
        const me = this;
        me.scroller.zoomToFit({
            minScale         : me.zoomSettings.min,
            maxScale         : me.zoomSettings.max,
            scaleGrid        : me.zoomSettings.step,
            padding          : me.zoomSettings.padding,
            useModelGeometry : true
        });
        return me;
    }
    selectNode(id) {
        const
            { scroller, paper } = this,
            highlighterId       = 'selection';
        highlighters.mask.removeAll(paper, highlighterId);
        if (!id) {
            return;
        }
        const cellView = paper.findViewByModel(id);
        if (!cellView) {
            return;
        }
        const element = cellView.model;
        if (!element.isElement()) {
            return;
        }
        highlighters.mask.add(cellView, 'body', highlighterId, {
            attrs : {
                strokeLinejoin : 'round',
                stroke         : '#3498db',
                strokeWidth    : 3
            }
        });
        // Scroll to an element only if it is not completely in the viewport.
        if (!scroller.isElementVisible(element, { strict : true })) {
            scroller.scrollToElement(element, { animation : true });
        }
    }
    isNodeHighlighted(id) {
        if (!id) {
            return false;
        }
        const cellView = this.paper.findViewByModel(id);
        if (!cellView) {
            return false;
        }
        // Check if a highlighter with the given ID is present on the cellView
        const highlighter = dia.HighlighterView.get(cellView, 'selection');
        return Boolean(highlighter);
    }
    addClickEventListener(callback) {
        this.paper.on('element:pointerclick', (elementView, evt) => {
            callback(elementView.model.id, evt);
        });
        this.paper.on('blank:pointerclick', (evt) => {
            callback(null, evt);
        });
    }
    setStyle() {
        const { toolbar } = this;
        if (toolbar) {
            toolbar.el.style.position = 'absolute';
            toolbar.el.style.top = '10px';
            toolbar.el.style.left = '10px';
        }
    }
    setListeners() {
        const { paper, scroller } = this;
        paper.on('paper:pinch', (evt, ox, oy, scale) => {
            evt.preventDefault();
            scroller.zoom(scale - 1, {
                min : this.zoomSettings.min,
                max : this.zoomSettings.max,
                ox,
                oy
            });
        });
        paper.on('paper:pan', (evt, tx, ty) => {
            evt.preventDefault();
            scroller.el.scrollLeft += tx;
            scroller.el.scrollTop += ty;
        });
        // Initiate panning when the user grabs the blank area of the paper.
        paper.on('blank:pointerdown', (evt) => {
            scroller.startPanning(evt);
        });
        paper.on('element:pointerclick', (elementView) => {
            this.selectNode(elementView.model.id);
        });
        paper.on('blank:pointerclick', () => {
            this.selectNode(null);
        });
    }
    createCells(data = []) {
        const
            tasks        = data.map((task) => TaskElement.fromData(task)),
            dependencies = [];
        data.forEach((task) => {
            task.dependencies.forEach((targetTask) => {
                const link = new DependencyLink({
                    source : { id : `${task.id}`, anchor : { name : 'right' } },
                    target : { id : `${targetTask}`, anchor : { name : 'left' } }
                });
                dependencies.push(link);
            });
        });
        return [...tasks, ...dependencies];
    }
    layoutCells() {
        const { graph } = this;
        return DirectedGraph.layout(graph, {
            rankDir         : 'LR',
            setLinkVertices : true,
            nodeSep         : 60,
            rankSep         : 60
        });
    }
    resetCells(cells) {
        const
            currentCells = this.graph.getCells(),
            { graph }    = this,
            cellsMap     = {};
        // Here we do not want to remove the existing elements but only update them if they exist.
        // e.g. Using resetCells() would remove all elements from the graph and add new ones.
        cells.forEach((cell) => {
            cellsMap[cell.id] = cell;
            const originalCell = graph.getCell(cell.id);
            if (originalCell) {
                // `dirty` to make sure the arrowheads are re-rendered
                originalCell.set(cell.attributes);
            }
            else {
                graph.addCell(cell);
            }
        });
        // Remove cells that are no longer in the data.
        currentCells.forEach((cell) => {
            if (!cellsMap[cell.id]) {
                cell.remove();
            }
        });
    }
    onRemove() {
        this.paper.remove();
        this.scroller.remove();
        this.toolbar.remove();
    }
}
This is the core PERT chart code, which uses the @joint/plus (JointJS) library, but it’s not enough. Add the following class after imports to create and render tasks on the canvas:
class TaskElement extends Record {
    preinitialize() {
        this.markup = util.svg/* xml */`
            <rect @selector="body" />
            <path @selector="nameRow" @group-selector="rows"/>
            <rect @selector="assigneeRow" @group-selector="rows"/>
            <rect @selector="progressBar" />
            <rect @selector="progressRow" @group-selector="rows"/>
            <text @selector="name" @group-selector="labels"/>
            <text @selector="assignee" @group-selector="labels"/>
            <text @selector="progress" @group-selector="labels"/>
        `;
    }

    defaults() {
        return {
            ...super.defaults,
            type    : 'task',
            z       : 2,
            size    : { width : 200 },
            padding : {
                top    : theme.headerHeight,
                bottom : theme.assigneeHeight + theme.progressHeight
            },
            itemHeight : 30,
            attrs      : util.defaultsDeep(
                {
                    root : {
                        magnetSelector : 'body'
                    },
                    body : {
                        width  : 'calc(w)',
                        height : 'calc(h)',
                        fill   : 'transparent'
                    },
                    nameRow : {
                        d      : `M 0 ${theme.headerHeight} L 0 15 A 15 15 0 0 1 15 0 L calc(w - 15) 0 A 15 15 0 0 1 calc(w) 15 L calc(w) ${theme.headerHeight} Z`,
                        stroke : theme.outlineColor,
                        fill   : '#fff'
                    },
                    assigneeRow : {
                        x      : 0,
                        y      : `calc(h - ${theme.assigneeHeight + theme.progressHeight})`,
                        width  : 'calc(w)',
                        height : theme.assigneeHeight,
                        stroke : theme.outlineColor,
                        fill   : theme.bgColor
                    },
                    progressRow : {
                        x      : 0,
                        y      : `calc(h - ${theme.progressHeight})`,
                        width  : 'calc(w)',
                        height : theme.progressHeight,
                        stroke : theme.outlineColor,
                        fill   : 'transparent'
                    },
                    progressBar : {
                        x           : 0,
                        y           : `calc(h - ${theme.progressHeight})`,
                        width       : 50,
                        height      : theme.progressHeight,
                        strokeWidth : 1,
                        fill        : {
                            type  : 'pattern',
                            attrs : {
                                width            : 12,
                                height           : 12,
                                strokeWidth      : 4,
                                stroke           : theme.outlineColor,
                                fill             : 'none',
                                patternTransform : 'rotate(90)'
                            },
                            markup : util.svg/* xml */`
                                  <rect width="12" height="12" fill="${theme.bgColor}" stroke="none" />
                                  <path d="M 0 0 L 12 12 M 6 -6 L 18 6 M -6 6 L 6 18" />
                              `
                        }
                    },
                    rows : {
                        strokeWidth : 2
                    },
                    name : {
                        y          : theme.headerHeight / 2,
                        fontWeight : 'bold',
                        textWrap   : {
                            width        : 'calc(w - 20)',
                            maxLineCount : 2,
                            ellipsis     : true
                        }
                    },
                    progress : {
                        y           : `calc(h - ${theme.progressHeight / 2})`,
                        paintOrder  : 'stroke',
                        stroke      : theme.bgColor,
                        strokeWidth : 2,
                        fill        : theme.textColor
                    },
                    assignee : {
                        y    : `calc(h - ${theme.progressHeight + theme.assigneeHeight / 2})`,
                        text : 'Assignee'
                    },
                    labels : {
                        x                  : 'calc(w / 2)',
                        fill               : theme.textColor,
                        fontSize           : theme.fontSize,
                        fontFamily         : 'Arial, sans-serif',
                        textAnchor         : 'middle',
                        textVerticalAnchor : 'middle'
                    },
                    itemBodies : {
                        stroke      : theme.outlineColor,
                        fill        : theme.bgColor,
                        strokeWidth : 2
                    },
                    itemLabels : {
                        fontSize   : theme.fontSize,
                        fontFamily : 'Arial, sans-serif',
                        fill       : theme.textColor
                    }
                    // @ts-ignore
                },
                super.defaults.attrs
            )
        };
    }

    static formatDate(date) {
        return `${date.getDate()}/${date.getMonth() + 1}/${date.getFullYear()}`;
    }

    static getEndDate(startDate, duration) {
        const endDate = new Date(startDate);
        endDate.setDate(endDate.getDate() + duration);
        return endDate;
    }

    static fromData(data) {
        const {
                id,
                name        = '',
                assignee,
                percentDone = 0,
                startDate,
                duration,
                color : userColor
            }       = data,
            endDate = startDate
                ? TaskElement.getEndDate(new Date(startDate), duration)
                : null;
        let color;
        if (userColor) {
            color = userColor;
        }
        else {
            color =
                percentDone === 100
                    ? theme.taskDoneColor
                    : theme.percentDone === 0
                        ? theme.taskColor
                        : theme.taskInProgressColor;
        }
        return new this({
            id    : `${id}`,
            attrs : {
                name : {
                    text : name
                },
                assignee : {
                    text : assignee || 'Assignee',
                    fill : assignee ? theme.textColor : theme.disabledTextColor
                },
                progress : {
                    text : `${percentDone}%`
                },
                progressBar : {
                    width  : `calc(${percentDone / 100} * w)`,
                    stroke : color,
                    fill   : {
                        attrs : {
                            stroke : color
                        }
                    }
                },
                nameRow : {
                    fill : color
                }
            },
            items : [
                [
                    {
                        id    : 'task_id',
                        label : `ID: ${id}`
                    },
                    {
                        id    : 'start_date',
                        label : startDate
                            ? TaskElement.formatDate(new Date(startDate))
                            : '-'
                    }
                ],
                [
                    {
                        id    : 'duration',
                        label : duration ? `${duration} day${duration > 1 ? 's' : ''}` : '-'
                    },
                    {
                        id    : 'end_date',
                        label : endDate ? TaskElement.formatDate(new Date(endDate)) : '-'
                    }
                ]
            ]
        });
    }
}
For the dependencies, add the following below the TaskElement class:
// This class create dependencies between nodes
class DependencyLink extends shapes.standard.Link {
    defaults() {
        return {
            ...super.defaults,
            type  : 'dependency',
            z     : 1,
            attrs : util.defaultsDeep(
                {
                    line : {
                        stroke       : theme.dependencyColor,
                        strokeWidth  : 2,
                        targetMarker : {
                            type : 'path',
                            d    : 'M 10 -5 0 0 10 5'
                        }
                    }
                    // @ts-ignore
                },
                super.defaults.attrs
            )
        };
    }
}
Add this code after the DependencyLink class to customize the minimap:
const UpdateFlags = {
    Render    : '@render',
    Update    : '@update',
    Transform : '@transform'
};

// Minimap navigation
const NavigatorElementView = dia.ElementView.extend({
    body                   : null,
    markup                 : util.svg/* xml */`<path @selector="body" />`,
    // updates run on view initialization
    initFlag               : [UpdateFlags.Render, UpdateFlags.Update, UpdateFlags.Transform],
    // updates run when the model attribute changes
    presentationAttributes : {
        position : [UpdateFlags.Transform],
        angle    : [UpdateFlags.Transform],
        color    : [UpdateFlags.Update],
        size     : [UpdateFlags.Update] // shape
    },
    // calls in an animation frame after a multiple changes
    // has been made to the model
    confirmUpdate : function(flags) {
        const me = this;
        if (me.hasFlag(flags, UpdateFlags.Render)) me.render();
        if (me.hasFlag(flags, UpdateFlags.Update)) me.update();
        // using the original `updateTransformation()` method
        if (me.hasFlag(flags, UpdateFlags.Transform)) me.updateTransformation();
    },
    render : function() {
        const
            me  = this,
            doc = util.parseDOMJSON(me.markup);
        me.body = doc.selectors.body;
        me.body.classList.add(me.model.get('group'));
        me.el.appendChild(doc.fragment);
    },
    update : function() {
        const
            { model, body }   = this,
            { width, height } = model.size(),
            d                 = `M 0 0 H ${width} V ${height} H 0 Z`;
        body.setAttribute('d', d);
        body.setAttribute('fill', model.get('color'));
    }
});
Next, create a src/lib/Theme.js file:
const theme = {
    backgroundColor     : 'transparent',
    bgColor             : '#ffffff',
    textColor           : '#262b30',
    disabledTextColor   : '#95a5a6',
    outlineColor        : '#2c3e50',
    dependencyColor     : '#2c3e50',
    fontSize            : 14,
    taskDoneColor       : '#8aea92',
    taskInProgressColor : '#9cd7fc',
    taskColor           : '#cad8e3',
    headerHeight        : 40,
    assigneeHeight      : 30,
    progressHeight      : 20
};
export default theme;
This code contains all the styling for the PERT chart; feel free to tweak it to match your project colors.
Wrapping the PertChart.js in a Panel widget
We’ll wrap the PertChart.js code in a Bryntum Panel widget. Create a src/lib/PertPanel.js file and add the following to it:
import { Panel, DomHelper } from "@bryntum/gantt";
import PertChart from "./PertChart";
export default class PertPanel extends Panel {
  // Factoryable type name
  static type = "pertpanel";
  // Required to store class name for IdHelper and bryntum.query in IE11
  static $name = "PertPanel";
  static configurable = {
    monitorResize: true,
    // Some defaults of the initial map display
    textContent: false,
    zoomRatio: 0.4,
    // Toolbar buttons
    tbar: [
      {
        type: "widget",
        cls: "widget-title",
        html: "Pert Chart View",
        flex: 1,
      },
      {
        type: "buttongroup",
        items: [
          {
            // icon: "b-fa b-fa-plus",
            text: "Zoom to Fit",
            onClick: "up.zoomToFit",
          },
          {
            icon: "b-fa b-fa-plus",
            onClick: "up.onZoomIn",
          },
          {
            icon: "b-fa b-fa-minus",
            onClick: "up.onZoomOut",
          },
          {
            text: "Show Minimap",
            onClick: "up.toggleNavigator",
          },
        ],
      },
    ],
  };
  construct() {
    const me = this;
    super.construct(...arguments);
    const mapContainerEl = me.contentElement;
    me.pertChart = new PertChart({
      target: mapContainerEl,
      toolbar: false,
    });
  }
}
PertPanel.initClass();
This is a simple wrapper for PertChart.js that treats the PERT chart as a Bryntum component. This makes it easy to add a Splitter between the charts and work seamlessly with the PERT chart.
The charts have different data structures, but we can extract the data from the Gantt chart, drop some properties, and use it to populate the Pert chart. Add the following functions to PertPanel:
  extractTasks(rawTasks, data, options) {
    let tasks = [];
    rawTasks.forEach((task) => {
      const {
        id,
        name,
        startDate,
        percentDone,
        duration,
        children = [],
      } = task;
      const assignees = (data.assignments[id] || []).map((resourceId) => {
        const resource = data.resources[resourceId];
        return resource ? resource.name : "";
      });
      const currentTask = {
        id,
        name,
        startDate,
        duration,
        percentDone,
        dependencies: data.dependencies[id] || [],
        assignee: assignees.join(", "),
      };
      tasks.push(currentTask);
      const childrenTasks = this.extractTasks(children, data, {
        ...options,
        childrenDependencies: true,
      });
      tasks.push(...childrenTasks);
    });
    return tasks;
  }
  extractDependencyMap(rawDependencies) {
    const dependencies = {};
    rawDependencies.forEach((dependency) => {
      const { fromTask, toTask } = dependency;
      dependencies[fromTask] || (dependencies[fromTask] = []);
      dependencies[fromTask].push(toTask);
    });
    return dependencies;
  }
  extractResourceMap(rawResources) {
    const resources = {};
    rawResources.forEach((resource) => {
      const { id, name } = resource;
      resources[id] = { id, name };
    });
    return resources;
  }
  extractAssignmentMap(rawAssignments) {
    const assignments = {};
    rawAssignments.forEach((assignment) => {
      const { event: taskId, resource: resourceId } = assignment;
      assignments[taskId] || (assignments[taskId] = []);
      assignments[taskId].push(resourceId);
    });
    return assignments;
  }
Finally, since it is a wrapper, we need to redefine functions like update and zoom:
update(data) {
    const tasks = this.extractTasks(data.tasks, {
      dependencies: this.extractDependencyMap(data.dependencies),
      resources: this.extractResourceMap(data.resources),
      assignments: this.extractAssignmentMap(data.assignments),
    });
    this.pertChart?.update(tasks);
  }
  zoomToFit() {
    this.pertChart?.zoomToFit();
  }
  onZoomOut() {
    this.pertChart?.zoomOut(this.zoomRatio);
  }
  onZoomIn() {
    this.pertChart?.zoomIn(this.zoomRatio);
  }
  onClickNode(callback) {
    return this.pertChart?.addClickEventListener((id) => {
      callback(id);
    });
  }
  selectNode(id) {
    this.pertChart?.selectNode(id);
  }
  toggleNavigator() {
    if (this.pertChart?.isNavigatorVisible()) {
      this.pertChart?.hideNavigator();
    } else {
      this.pertChart?.showNavigator();
    }
  }
Rendering the PERT chart
Now we can add a splitter and PertPanel to main.js after the gantt declaration:
import { Splitter } from "@bryntum/gantt";
import PertPanel from "./lib/PertPanel";

new Splitter({
  appendTo: "app",
});

const pertPanel = new PertPanel({
  appendTo: "app",
});
This will render an empty canvas for the PERT chart:
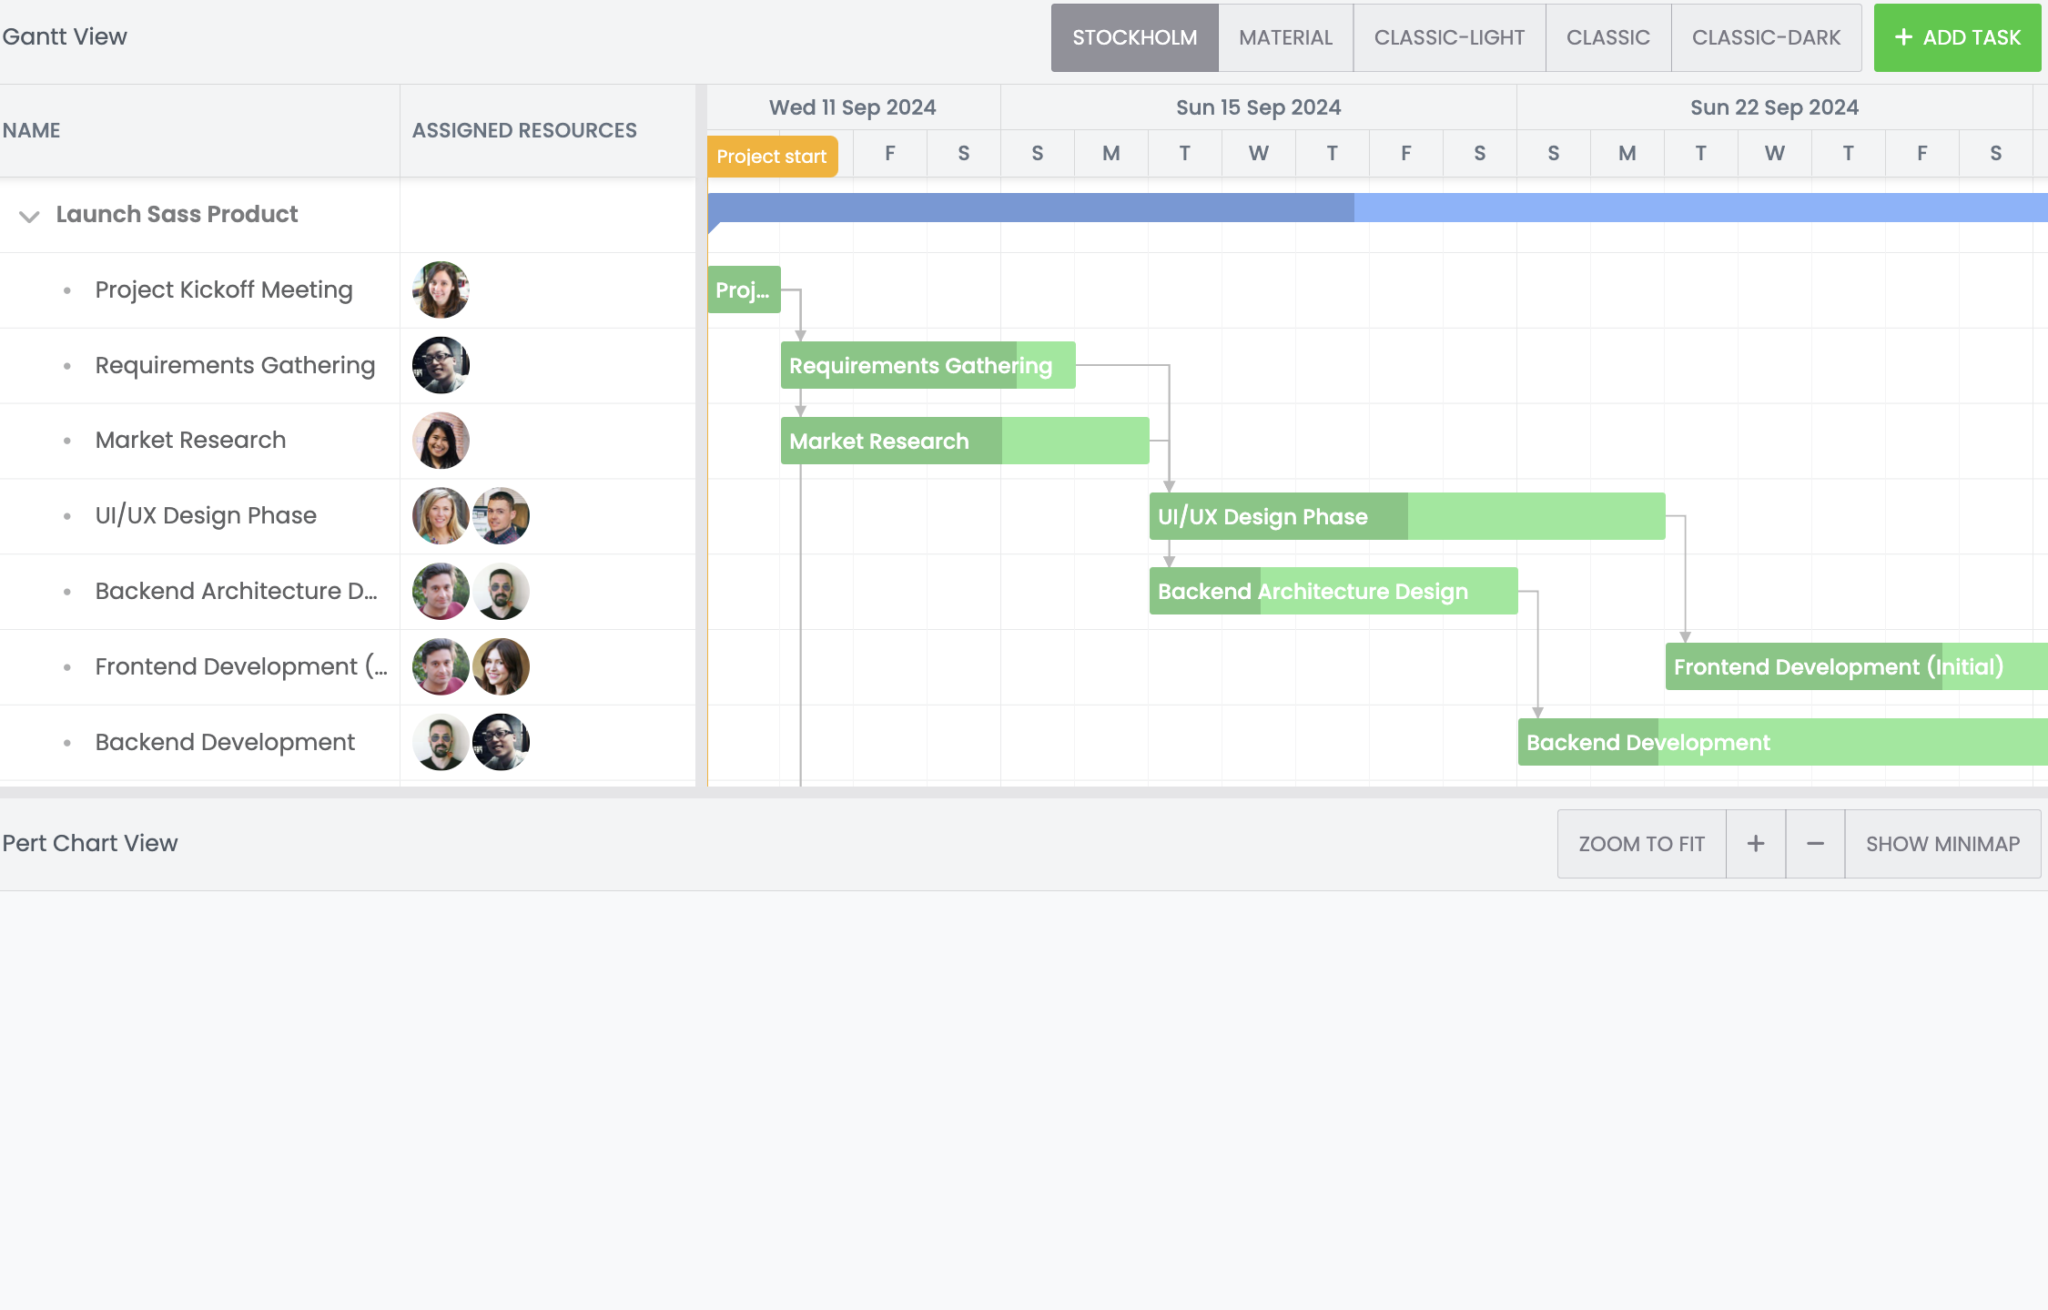
As the two charts are synced, we will use the Gantt data to populate the PERT chart.
Populating the PERT chart
Let’s use the functionality defined in PertPanel.js and PertChart.js in main.js. Add the following function to main.js:
const updatePertPanel = () => {
      const { project } = gantt;
      pertPanel.update({
          tasks        : project.eventStore.toJSON(),
          dependencies : project.dependencyStore.toJSON(),
          resources    : project.resourceStore.toJSON(),
          assignments  : project.assignmentStore.toJSON()
      });
  };
This function must be called whenever the Gantt data is loaded or modified.
gantt.project.on({
    load : () => {
        updatePertPanel();
        pertPanel.zoomToFit();
    },
    hasChanges : updatePertPanel
});
This will populate the PERT chart with the Gantt’s data:
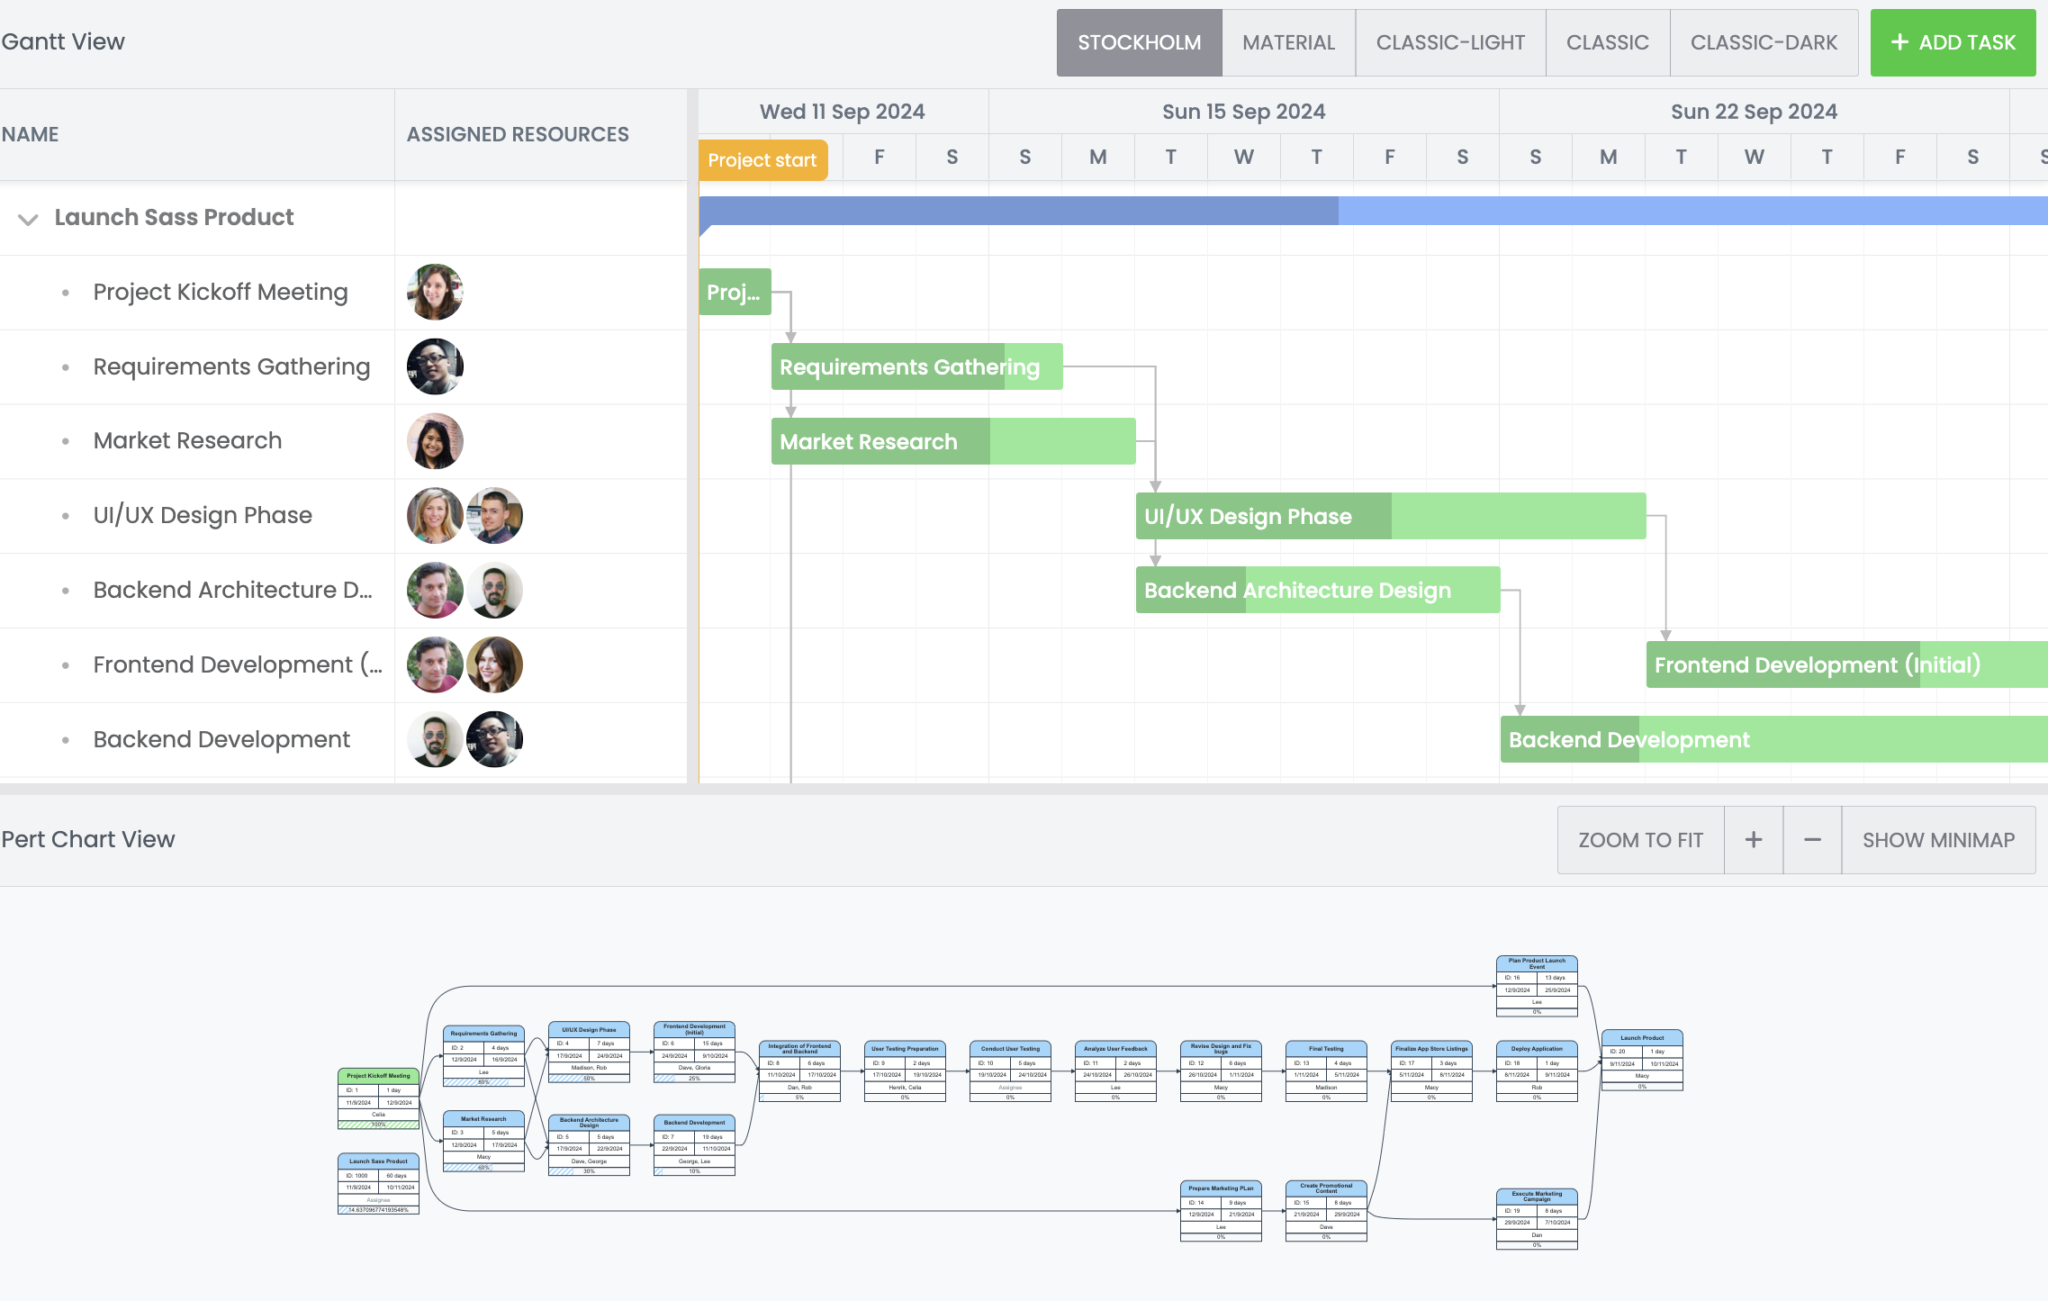
Notice that both the minimap and zoom features are also working in the PERT chart. These features are defined in the PertPanel.js – in case you’d like to take a look.
Highlighting the nodes
Let’s add functionality to highlight a task in the PERT chart when it is selected in the Gantt chart and vice versa. The highlight will trigger on:
- Task click
- Cell click
- Before cell edit starts (for example, when the
Returnkey is pressed while editing a task, shifting the focus to the next task name)
Add the following code to main.js:
gantt.on({
    taskClick({ row }) {
        pertPanel.selectNode(row.id);
    },
    cellClick({ record }) {
        pertPanel.selectNode(record.id);
    },
    beforeCellEditStart({ editorContext }) {
        pertPanel.selectNode(editorContext.id);
    }
});
Here, the PertChart.js code helps bring the node into focus.
To highlight a task in the Gantt chart when it’s selected in the PERT chart, add the following code to main.js:
let currentFocus = null;
pertPanel.onClickNode((id) => {
    if (id == null) {
        pertPanel.selectNode(currentFocus);
    }
    else {
        gantt.focusCell(
            {
                id
            },
            {
                doSelect : true,
                scroll   : true
            }
        );
        currentFocus = id;
    }
});
Switching themes
Finally, let’s add functionality to the theme buttons to change the theme for both charts. We’ll tweak the theme variable from src/lib/Theme.js to do this.
Add the following to main.js:
import theme from './lib/Theme.js';
gantt.tbar.widgetMap.theme.on('action', async({ source : button }) => {
  await DomHelper.setTheme(button.text);
  if (button.text === 'Classic-Dark') {
      theme.bgColor = 'transparent';
      theme.textColor = '#ffffff';
      theme.taskDoneColor = '#8fbb91';
      theme.taskInProgressColor = '#5ea1ed';
      updatePertPanel();
  }
  else if (button.text === 'Classic') {
      theme.backgroundColor = '#ffffff';
      updatePertPanel();
  }
  else {
      theme.textColor = '#262b30';
      updatePertPanel();
  }
});
You can access the final code for this integration on GitHub or see our JointJS example on the Bryntum website. JointJS charts are available from Bryntum 6.1.8.
Next steps
Now that you know how to integrate JointJS with Bryntum Gantt, you might like to try using JointJS with other Bryntum components to create custom charts and visualization systems.
If you’re new to Bryntum, we offer a 45-day free trial of all our components—feel free to explore them! Have questions? Join the discussion in our forums and get the answers you need.
Build it with Bryntum Gantt
Start a free trial, explore live demos, or read the docs.