Creating nested data tables using Bryntum Grid
We strive to keep posts updated, but code samples may sometimes be outdated. Humans, see the Bryntum documentation; agents, https://mcp.bryntum.com for the latest info.
If your data includes nested, related, or hierarchical structures, you might want to implement nested data grids with Bryntum Grid to more easily view and navigate complex data.
In this tutorial, we’ll show you how to build a nested grid for student exam records with Bryntum Grid. The project we are going to develop incorporates two data models: “students” and “marks.” We will represent these two entities with two Model classes – Student and Marks, where each of them defines the structure of the entity. Within the context of a Bryntum Grid, a data model refers to the schema or structure of records that are to be populated within the grid. We’ll use plain JavaScript in this blog post, but you can apply the same methods with any framework.
Getting started
Start by doing the following:
- Create a Vanilla JavaScript Vite project using
npm create vite@latest. - Add the project name (for example,
nested-grid). - Select
Vanilla>JavaScript. - Install the dependencies with
cd nested-grid && npm install.
Now, you can install the Bryntum Grid using npm. First, get access to the Bryntum private npm registry by following the guide in our docs. When you’ve logged in to the registry, install Bryntum Grid by following this guide.
You can also use this starter code as a starting point by cloning it locally. To do so:
- Clone the project locally using
git clone <https://github.com/bryntum/basic-nested-grid.git> - Follow the
README.md
We won’t need the counter.js file in the project, so you can delete it.
Create a basic grid
Start by creating a grid structure by replacing the content of main.js with the following code:
import "./style.css"
import { Grid } from "@bryntum/grid";

const grid = new Grid({
  appendTo: "app",

  columns: [
    {
      text: "Student",
      field: "name",
      icon: "b-fa b-fa-user",
      flex: "1",
    },
    {
      text: "Semester",
      field: "semester",
      icon: "b-fa b-fa-landmark",
      flex: 1,
    },
    {
      text: "Total Marks",
      field: "total",
			icon: "b-fa b-fa-graduation-cap",
      flex: 1,
    },
  ],

  data: [
    { id: 1, name: "Don A Taylor", semester: 8, total: 879 },
    { id: 2, name: "John Smith", semester: 4, total: 577 },
    { id: 3, name: "Eva Watson", semester: 7, total: 839 },
  ],
});
Replace the contents of style.css with the following:
/* Styling for Grid */
@import "./node_modules/@bryntum/grid/grid.stockholm.css";

body {
  padding: 0;
  margin: 0;
  font-family: sans-serif;
  font-size: 14px;
}

#app {
  height: 100vh;
}

/* Styling for column header */
.b-grid-header-text {
  font-weight: bold;
  font-size: 18px;
}

/* Spacing for cells */
.b-grid-row {
  height: 60px;
}

/* styling for nested grid */
.inner-grid {
  margin: 1em;
  border: 1px solid #ddd;
  border-bottom: none;
}
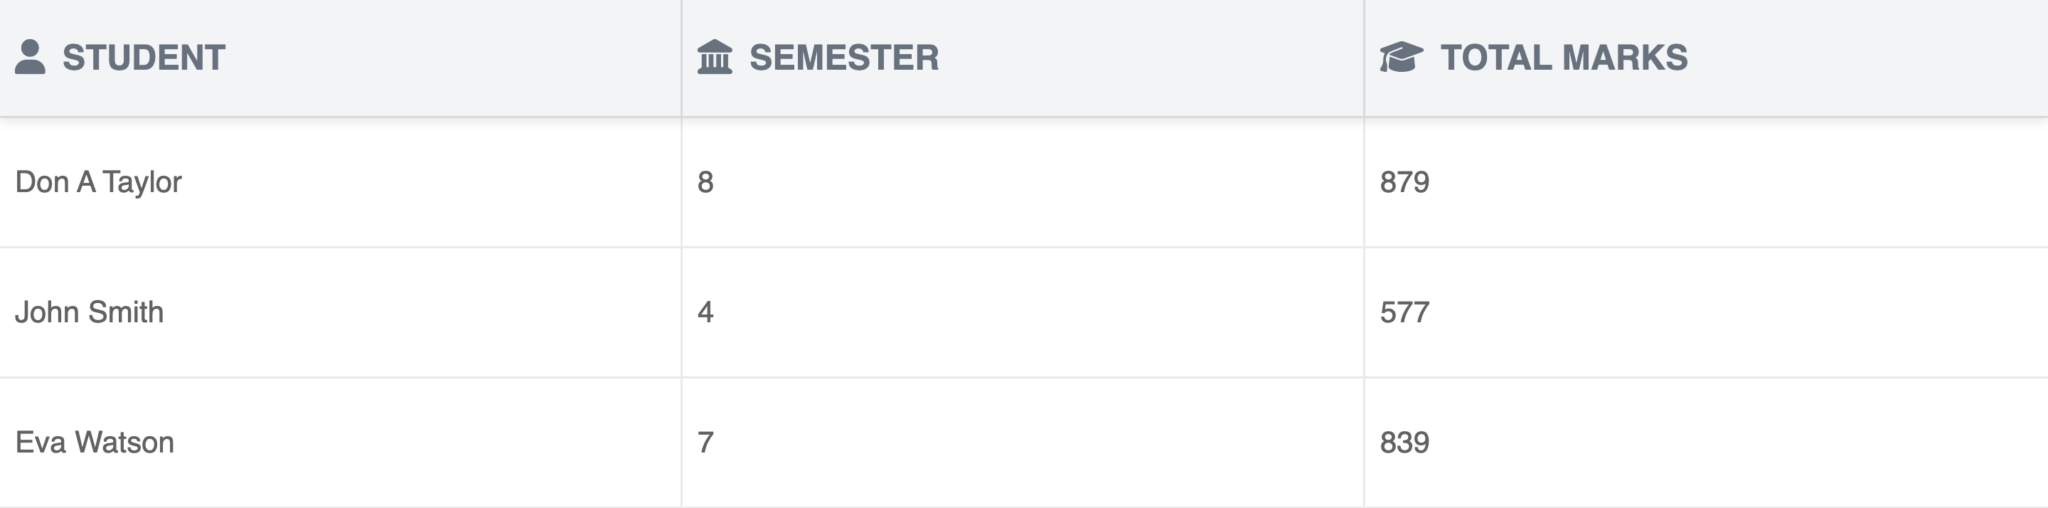
Start the development server with npm run dev. This will create a basic Bryntum Grid with three records.
Add a nested grid
Now we’ll add a nested grid.
To begin with, we’ll keep the data inline (inside the grid instance). Later we’ll move the data to a .json file to more closely resemble a real-world scenario.
We’ll use the rowExpander property to enable expanding grid rows. Add the following to main.js:
const grid = new Grid({
 // other config
  features: {
    rowExpander: {
      widget: marksGridConfig,
      dataField: "marks"
    }
  },

});
We use the widget base class to add the grid configuration and the dataField property to populate the grid store. Read more about field classes in our docs.
Next, create the marksGridConfig object by adding the following code before the new Grid({... function.
import { GridRowModel } from "@bryntum/grid";

class Marks extends GridRowModel {
  static fields = ["subject", "marks"];
}

const marksGridConfig = {
  type: "grid",
  cls: "inner-grid",
  modelClass: Marks,
  autoHeight: true,
  columns: [
    {
      text: "Subject",
      field: "subject",
      icon: "b-fa b-fa-graduation-cap",
      flex: 1,
    },
    {
      text: "Marks",
      field: "marks",
      icon: "b-fa b-fa-book",
      flex: 1,
    },
  ],
};
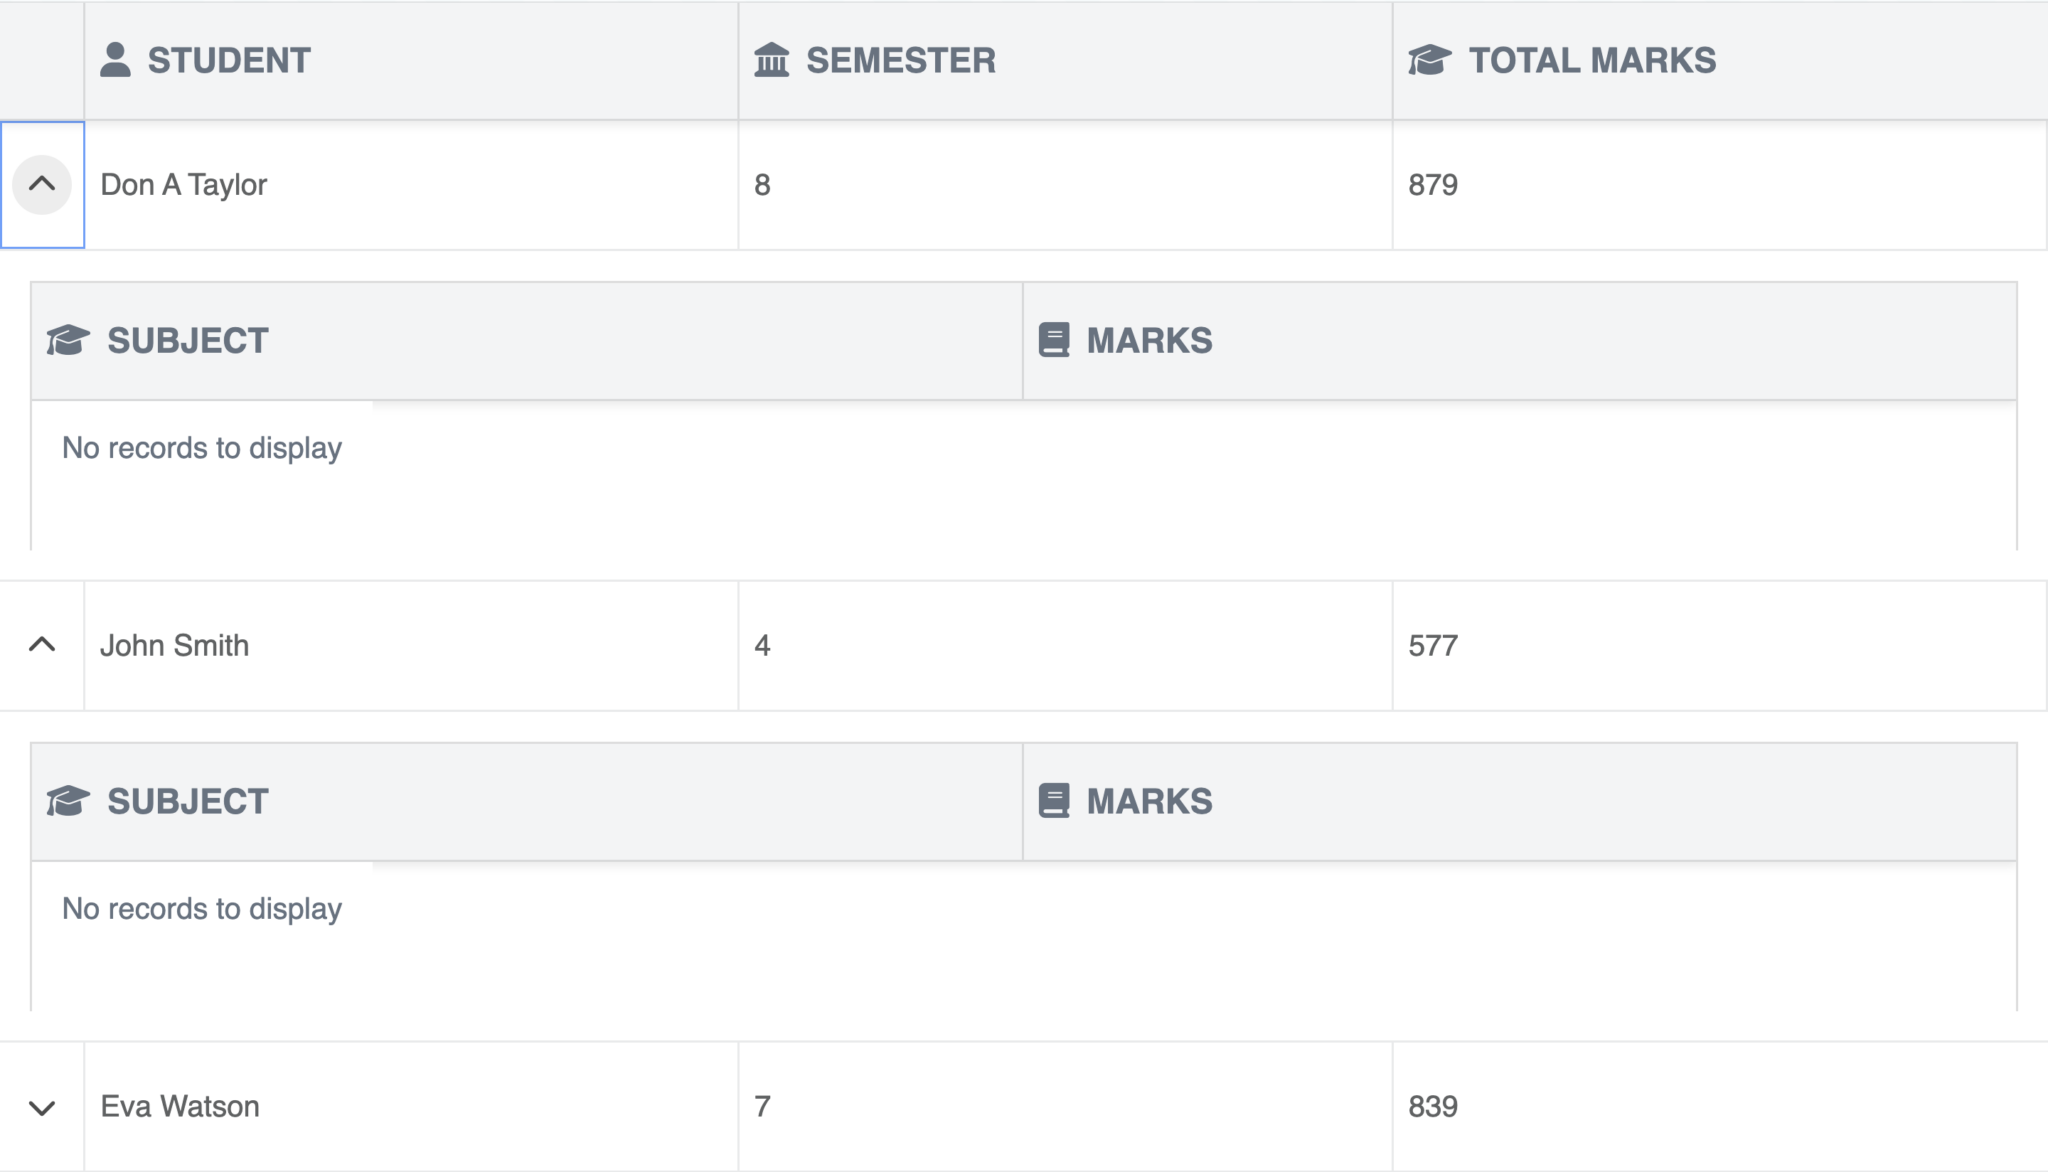
Now each record in the grid should contain an empty nested grid with two columns: “Subject” and “Marks”.
To populate the subgrid with data, replace the data field in the new Grid() instance with the following:
data: [
    {
      id: 1,
      name: "Don A Taylor",
      semester: 8,
      total: 879,
      marks: [
        { subject: "Physics", marks: 65 },
        { subject: "Computer", marks: 73 },
        { subject: "English", marks: 46 },
      ],
    },
    {
      id: 2,
      name: "John Smith",
      semester: 4,
      total: 577,
      marks: [
        { subject: "Physics", marks: 78 },
        { subject: "Computer", marks: 47 },
        { subject: "English", marks: 97 },
      ],
    },
    {
      id: 3,
      name: "Eva Watson",
      semester: 7,
      total: 839,
      marks: [
        { subject: "Physics", marks: 89 },
        { subject: "Computer", marks: 92 },
        { subject: "English", marks: 89 },
      ],
    },
  ],
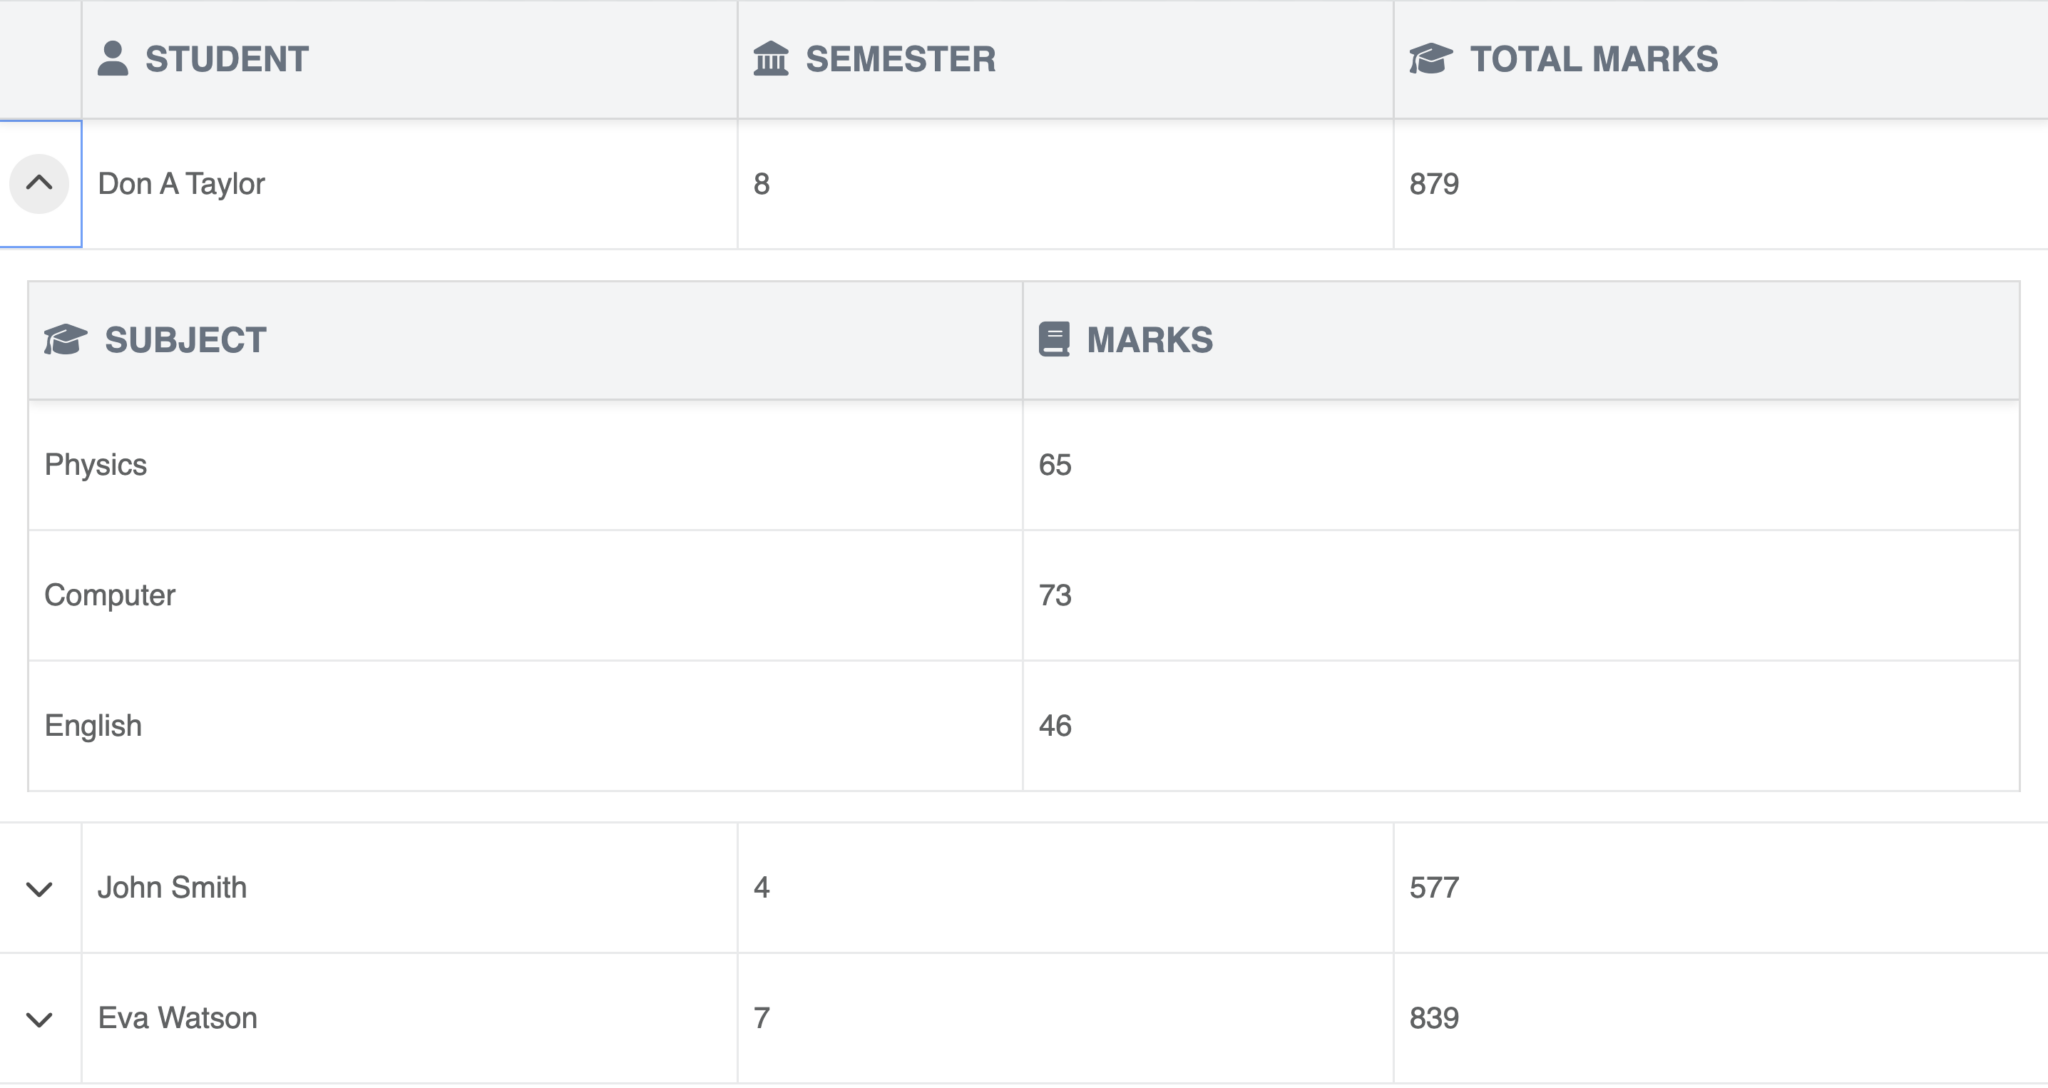
Now you should see the data in the grid. You can use dropdown button to expand each row and see the subjects’ marks.
Currently, the “Total marks” column contains dummy data. Let’s update it to display each student’s total marks. We’ll create a class to calculate the total value.
import { Grid, GridRowModel } from "@bryntum/grid";

class Student extends GridRowModel {
  static fields = ["name", "semester", "total"];

  // must match with the column's 'field' value
  get total() {
    return this.marks.reduce((acc, r) => acc + r.marks, 0);
  }
}

const grid = new Grid({
 // other config
 store: {
    modelClass: Student,
  },
});
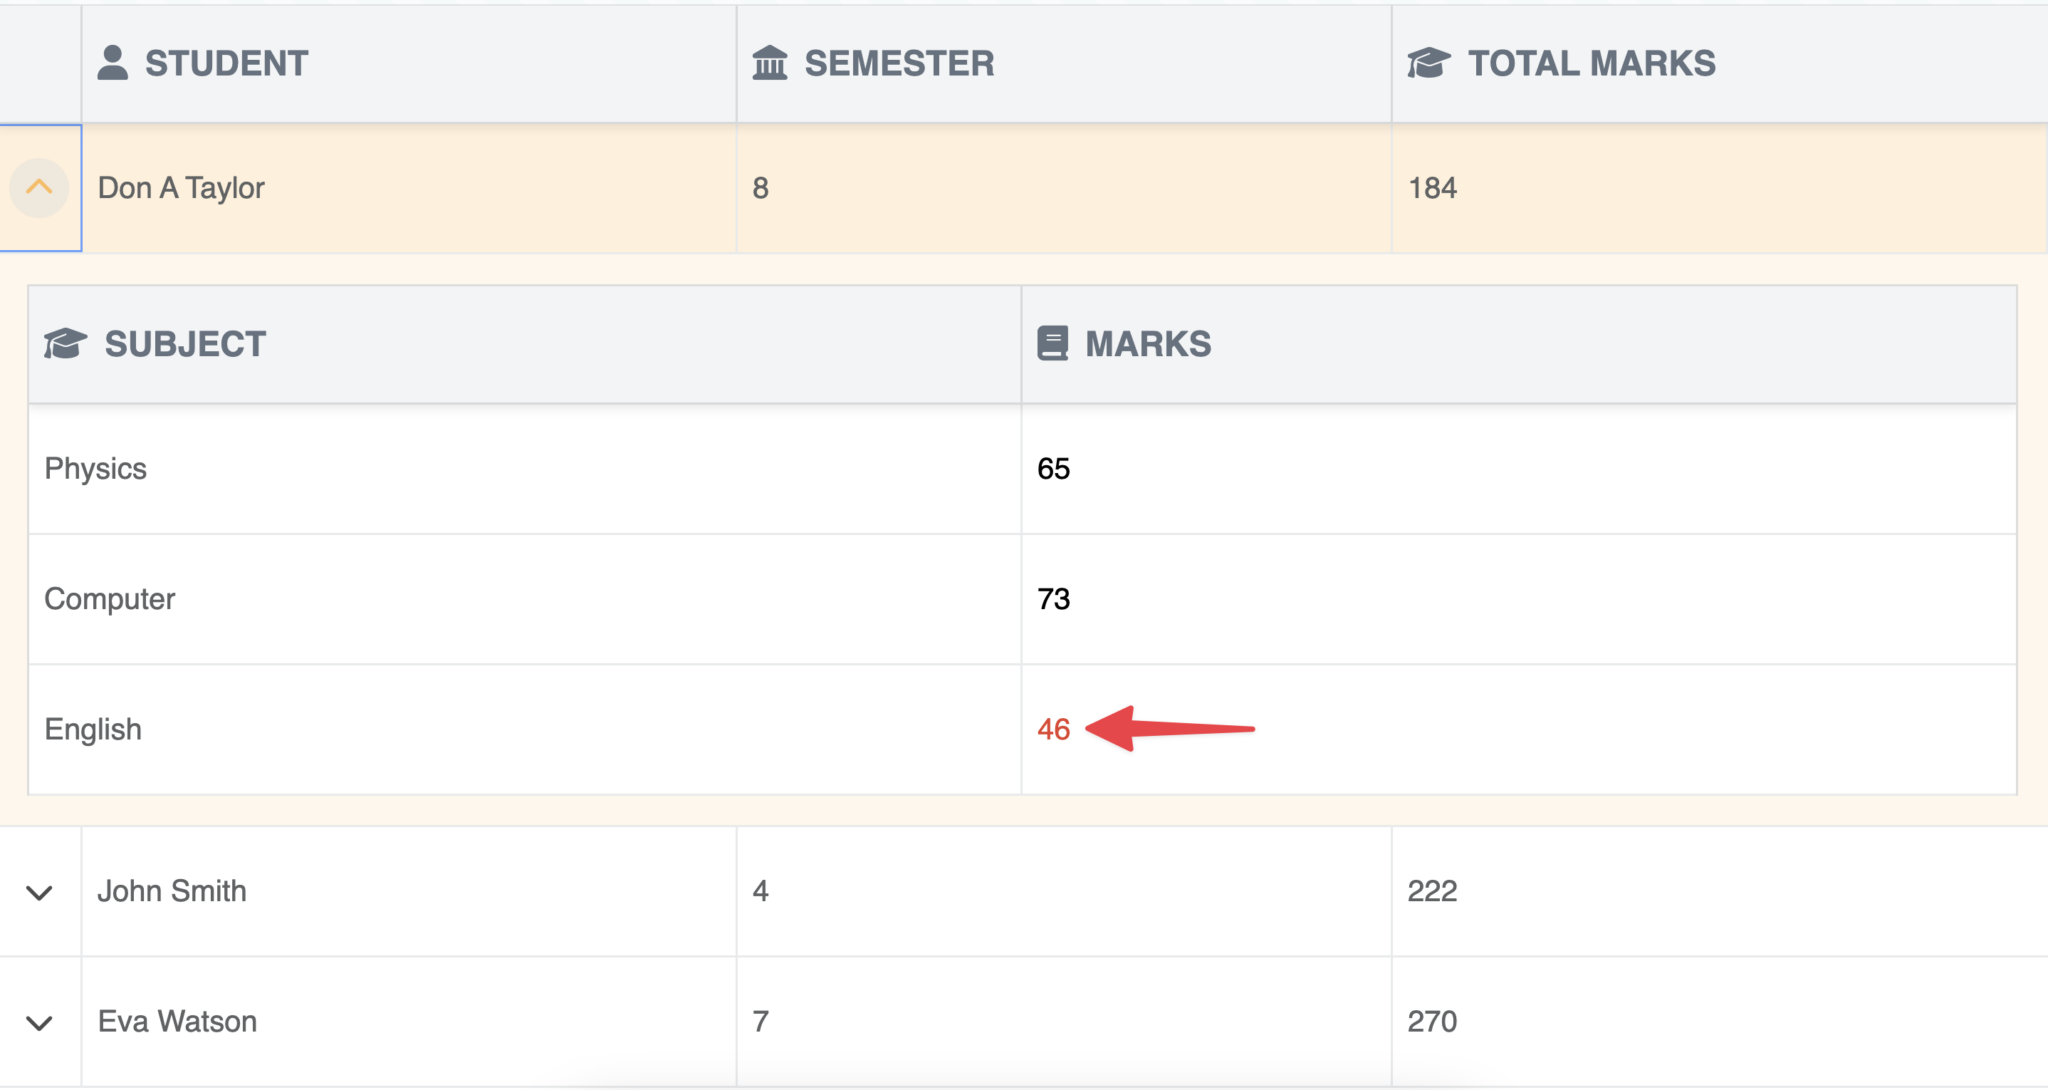
Remove the total fields from the data we added previously as we don’t need them anymore. The sum of the individual subject marks will now show in the “Total marks” column.
Let’s add some styling to the individual marks. Assuming that 50 is the passing mark, we want to highlight marks that are less than 50. Replace the “Marks” column in the marksGridConfig for the with the following.
    {
      text: "Marks",
      field: "marks",
      flex: 1,
      renderer({ value, cellElement }) {
        cellElement.style.color = value < 50 ? "#e53f2c" : "#000000";
        return value;
      },
    },
Now marks below 50 will be highlighted in the grid.
In production, the grid would fetch data from a database in JSON format. Let’s convert the current data into an external .json file.
Fetch data from external files
Create a public/data.json file and populate it with the following:
{
  "data": [
    {
      "id": 1,
      "imageid": "1",
      "name": "Don A Taylor",
      "semester": 8,
      "marks": [
        { "subject": "Physics", "marks": 65 },
        { "subject": "Computer", "marks": 73 },
        { "subject": "English", "marks": 46 }
      ]
    },
    {
      "id": 2,
      "imageid": 2,
      "name": "John Smith",
      "semester": 4,
      "marks": [
        { "subject": "Physics", "marks": 78 },
        { "subject": "Computer", "marks": 47 },
        { "subject": "English", "marks": 97 }
      ]
    },
    {
      "id": 3,
      "imageid": 3,
      "name": "Eva Watson",
      "semester": 7,
      "marks": [
        { "subject": "Physics", "marks": 89 },
        { "subject": "Computer", "marks": 92 },
        { "subject": "English", "marks": 89 }
      ]
    },
    {
      "id": 4,
      "imageid": 4,
      "name": "Liam Nguyen",
      "semester": 5,
      "marks": [
        { "subject": "Physics", "marks": 74 },
        { "subject": "Computer", "marks": 85 },
        { "subject": "English", "marks": 68 }
      ]
    },
    {
      "id": 5,
      "imageid": 5,
      "name": "Olivia Zhou",
      "semester": 2,
      "marks": [
        { "subject": "Physics", "marks": 88 },
        { "subject": "Computer", "marks": 90 },
        { "subject": "English", "marks": 91 }
      ]
    },
    {
      "id": 6,
      "imageid": 6,
      "name": "Emma Lin",
      "semester": 6,
      "marks": [
        { "subject": "Physics", "marks": 82 },
        { "subject": "Computer", "marks": 77 },
        { "subject": "English", "marks": 85 }
      ]
    },
    {
      "id": 7,
      "imageid": 7,
      "name": "Noah Kim",
      "semester": 3,
      "marks": [
        { "subject": "Physics", "marks": 90 },
        { "subject": "Computer", "marks": 92 },
        { "subject": "English", "marks": 87 }
      ]
    },
    {
      "id": 8,
      "imageid": 8,
      "name": "Isabella Santos",
      "semester": 1,
      "marks": [
        { "subject": "Physics", "marks": 95 },
        { "subject": "Computer", "marks": 98 },
        { "subject": "English", "marks": 94 }
      ]
    },
    {
      "id": 9,
      "imageid": 9,
      "name": "Mason Zhou",
      "semester": 8,
      "marks": [
        { "subject": "Physics", "marks": 66 },
        { "subject": "Computer", "marks": 89 },
        { "subject": "English", "marks": 70 }
      ]
    },
    {
      "id": 10,
      "imageid": 10,
      "name": "Sophia Clark",
      "semester": 4,
      "marks": [
        { "subject": "Physics", "marks": 78 },
        { "subject": "Computer", "marks": 82 },
        { "subject": "English", "marks": 76 }
      ]
    }
  ]
}
Create a public/avatars.json file and add the following to it:
[
  {
    "id": 1,
    "photo": "amit.jpg"
  },
  {
    "id": 2,
    "photo": "celia.jpg"
  },
  {
    "id": 3,
    "photo": "george.jpg"
  },
  {
    "id": 4,
    "photo": "henrik.jpg"
  },
  {
    "id": 5,
    "photo": "gloria.jpg"
  },
  {
    "id": 6,
    "photo": "lee.jpg"
  },
  {
    "id": 7,
    "photo": "malik.jpg"
  },
  {
    "id": 8,
    "photo": "steve.jpg"
  },
  {
    "id": 9,
    "photo": "linda.jpg"
  },
  {
    "id": 10,
    "photo": "lisa.jpg"
  }
]
We also need to add the .jpg images, which will be handled later. Now you can remove the data: [...] array from the new Grid() instance and replace the store with the following in the main.js:
store: {
    readUrl: "data.json",
    autoLoad: true,
    modelClass: Student,
 },
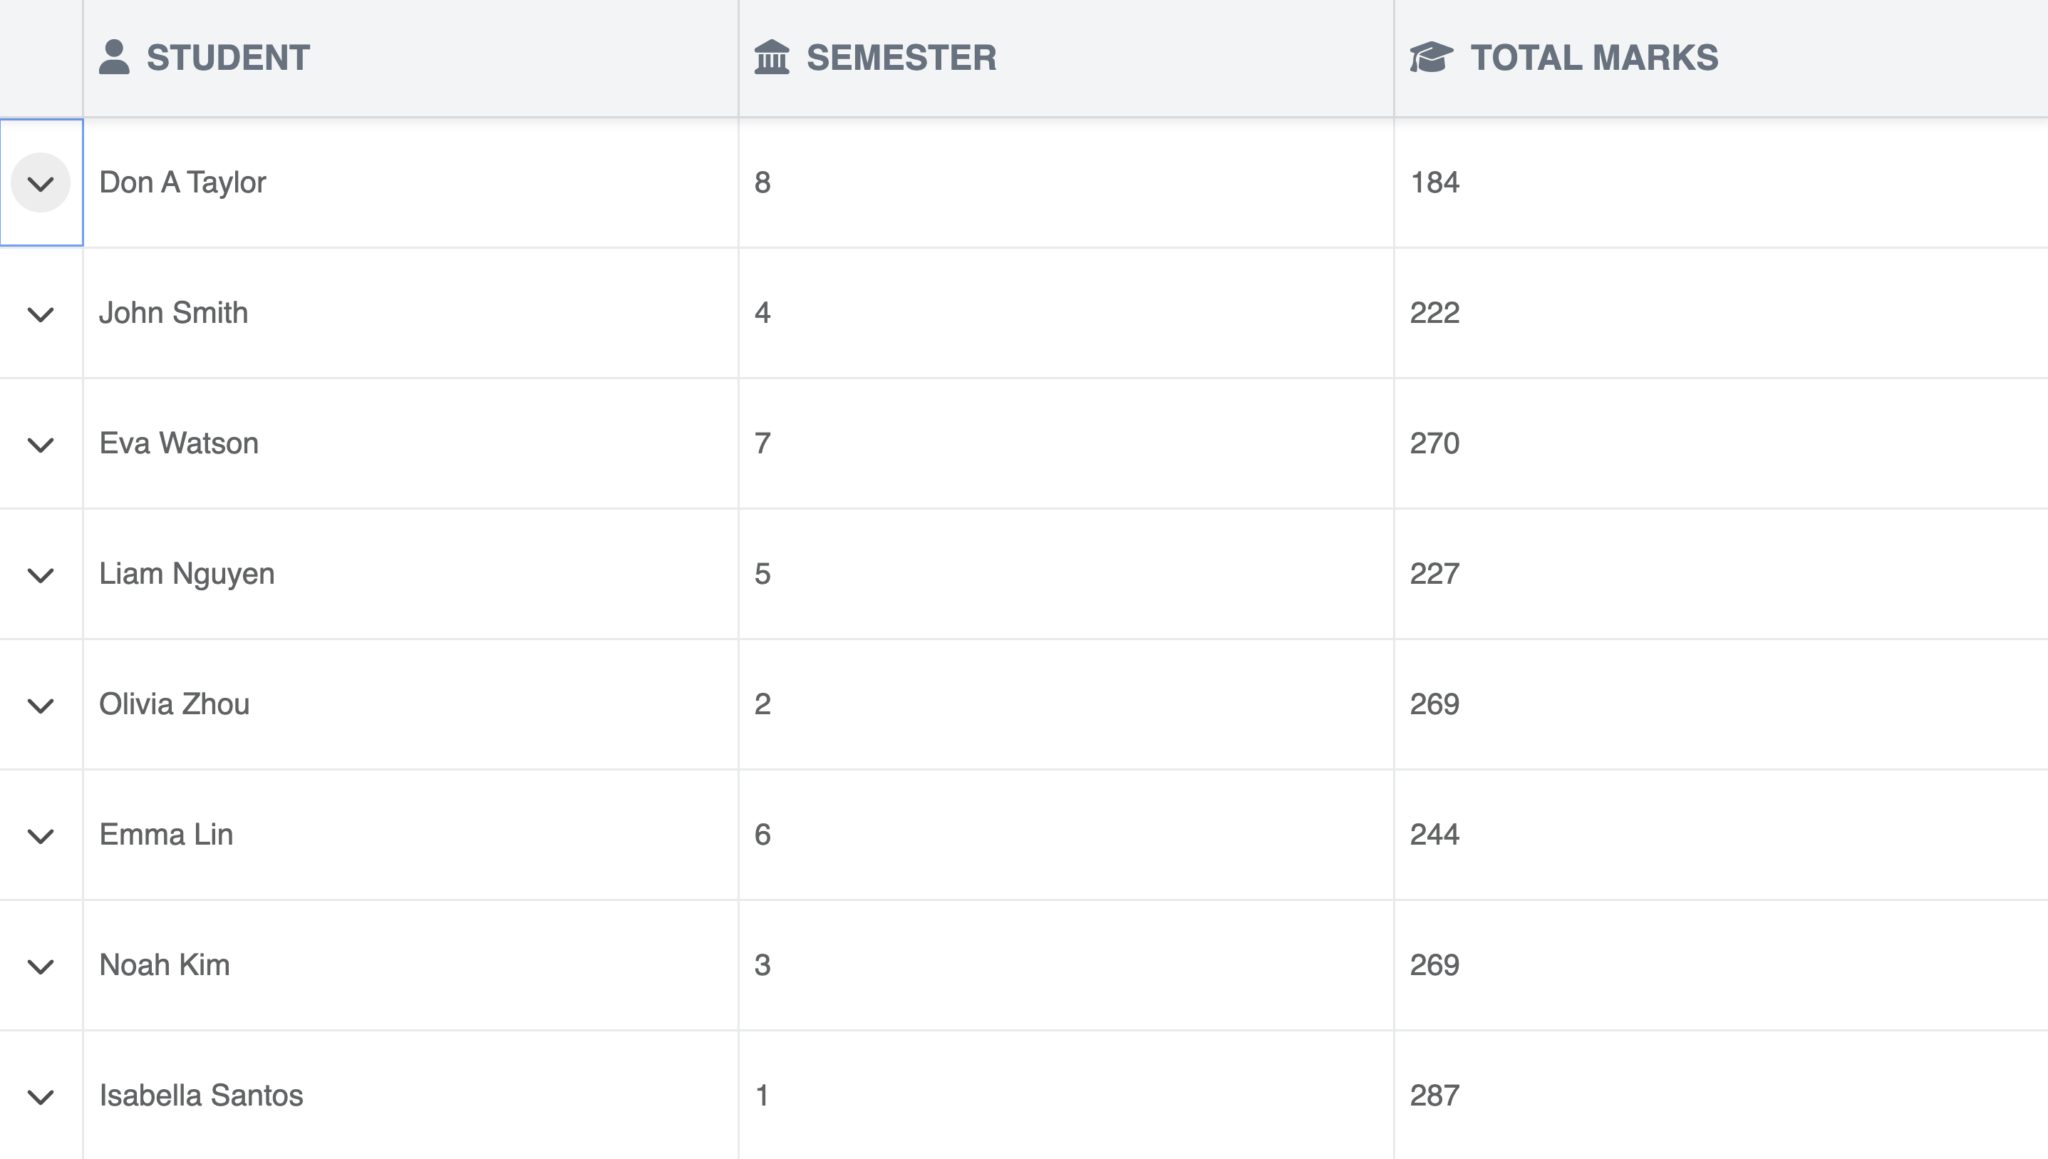
This will fetch the data from the data.json file and show it in the grid.
Now we’ll add avatars to the “Student” column. First load the avatars.json data using AjaxStore:
import { AjaxStore } from "@bryntum/grid";

const memberStore = new AjaxStore({
  readUrl: "/avatars.json",
});
Replace the “Name” column of the main grid with the following:
{
  text: "Student",
  field: "name",
  icon: "b-fa b-fa-user",
  flex: "1",
  renderer({ record, value }) {
  return {
    class: "name-container",
    children: [getAvatars(record.id), { html: value }],
  };
 },
},
Here, we use the getAvatars function, which is undefined. Add the following code before the grid instance to define the function:
const getAvatars = (id) => {
  const member = memberStore.getById(id);

  return member
    ? {
        tag: "img",
        class: "avatar",
        src: `/users/${member.photo}`,
      }
    : "";
};
Make sure to have photos in public/users/. You can get them from the GitHub starter code.
To populate the grid with the avatars, update the store with a listeners function and add the load() function to it:
store: {
    readUrl: "data.json",
    autoLoad: true,
    modelClass: Student,
    listeners: {
      async load() {
        await memberStore.load(); // Load the avatars
        grid.refreshRows?.(); // Triggers a render of records to all row elements.
      },
    },
  },
Add some styling to style.css to make the avatars look good:
/* Horizontal alignment avatar and name*/
.name-container {
  display: flex;
  gap: 10px;
  align-items: center;
}

.avatar {
  height: 2.5em;
  width: 2.5em;
  border-radius: 50%;
}
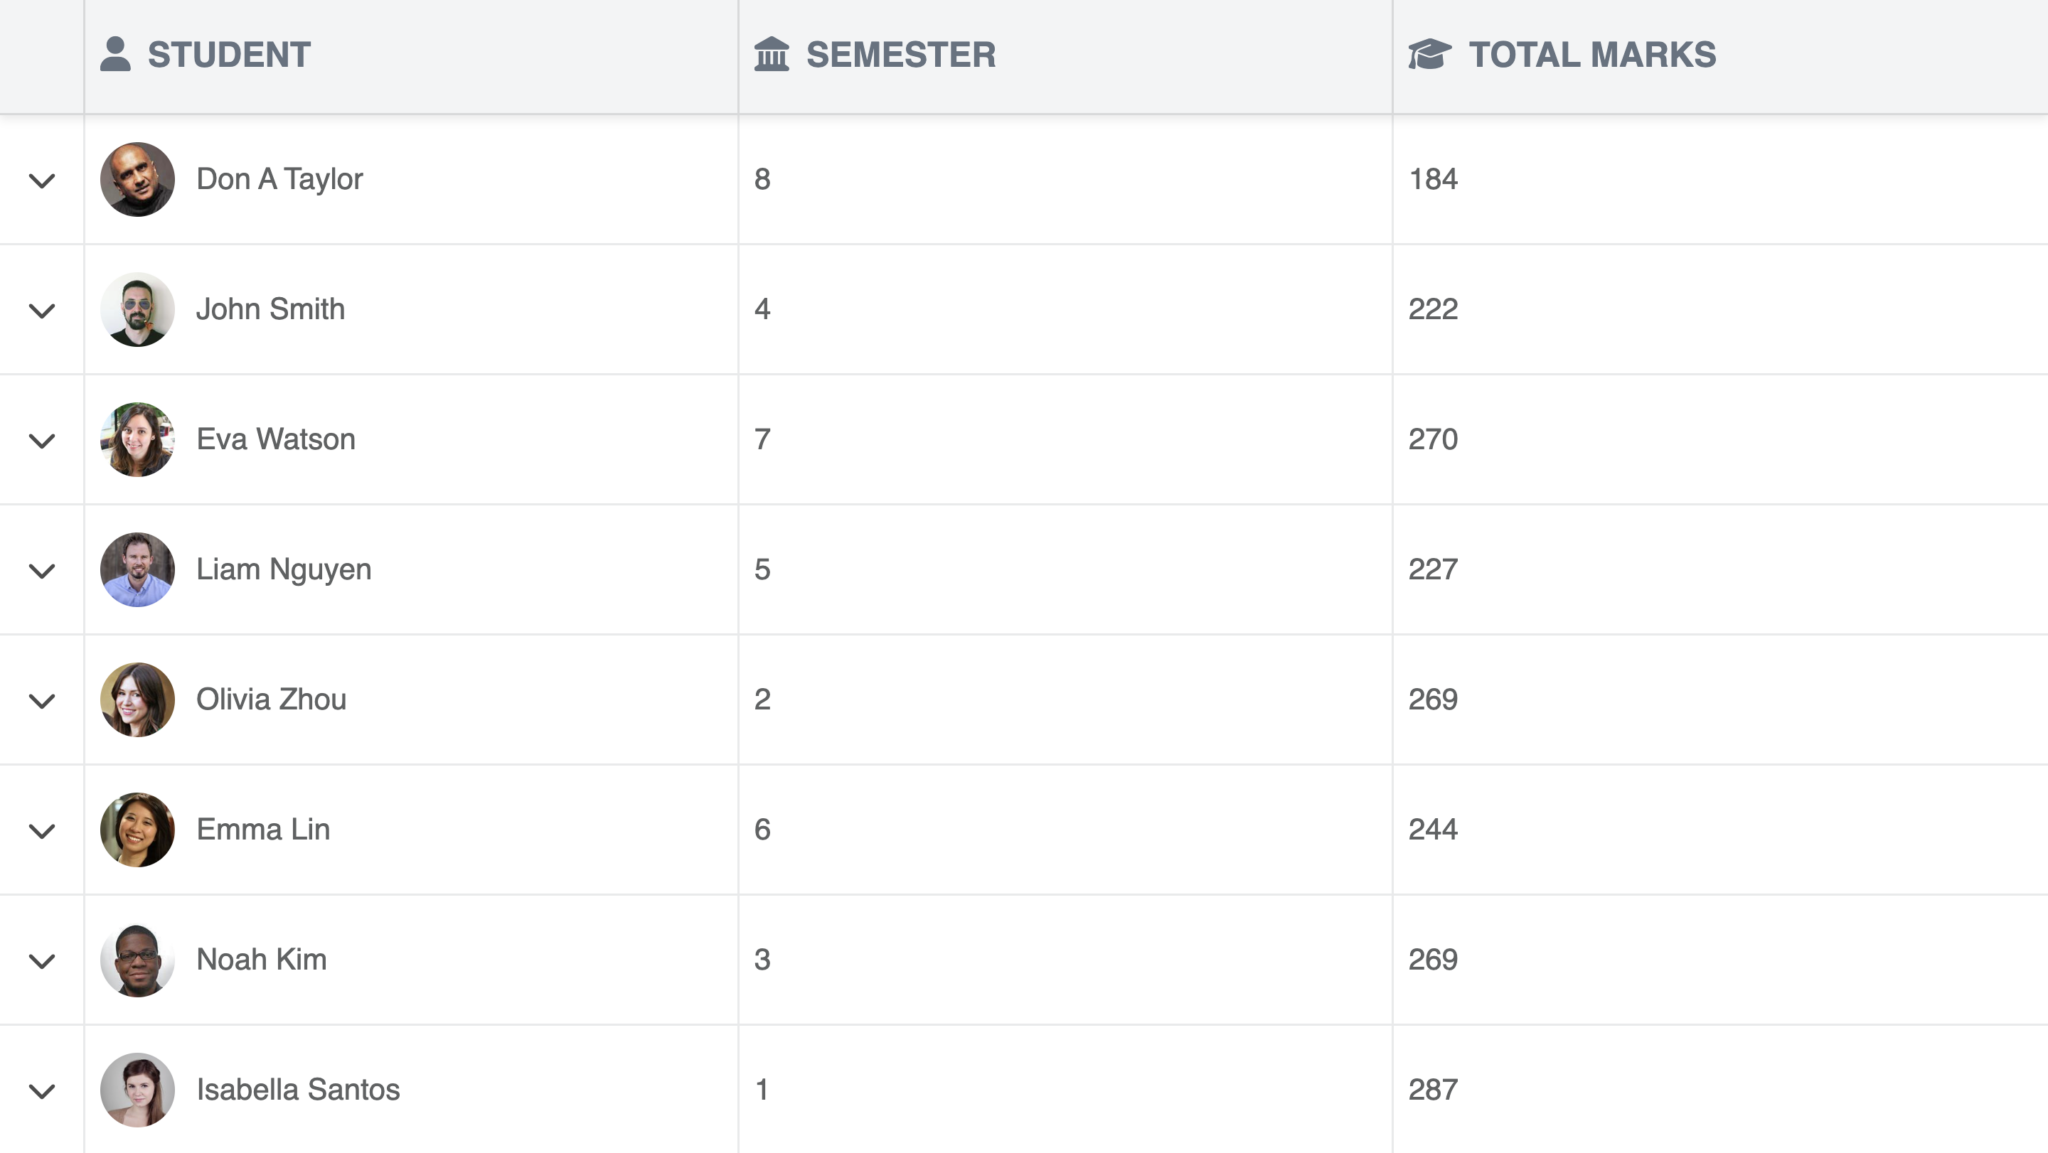
Now you should see the avatars in the “Name” column.
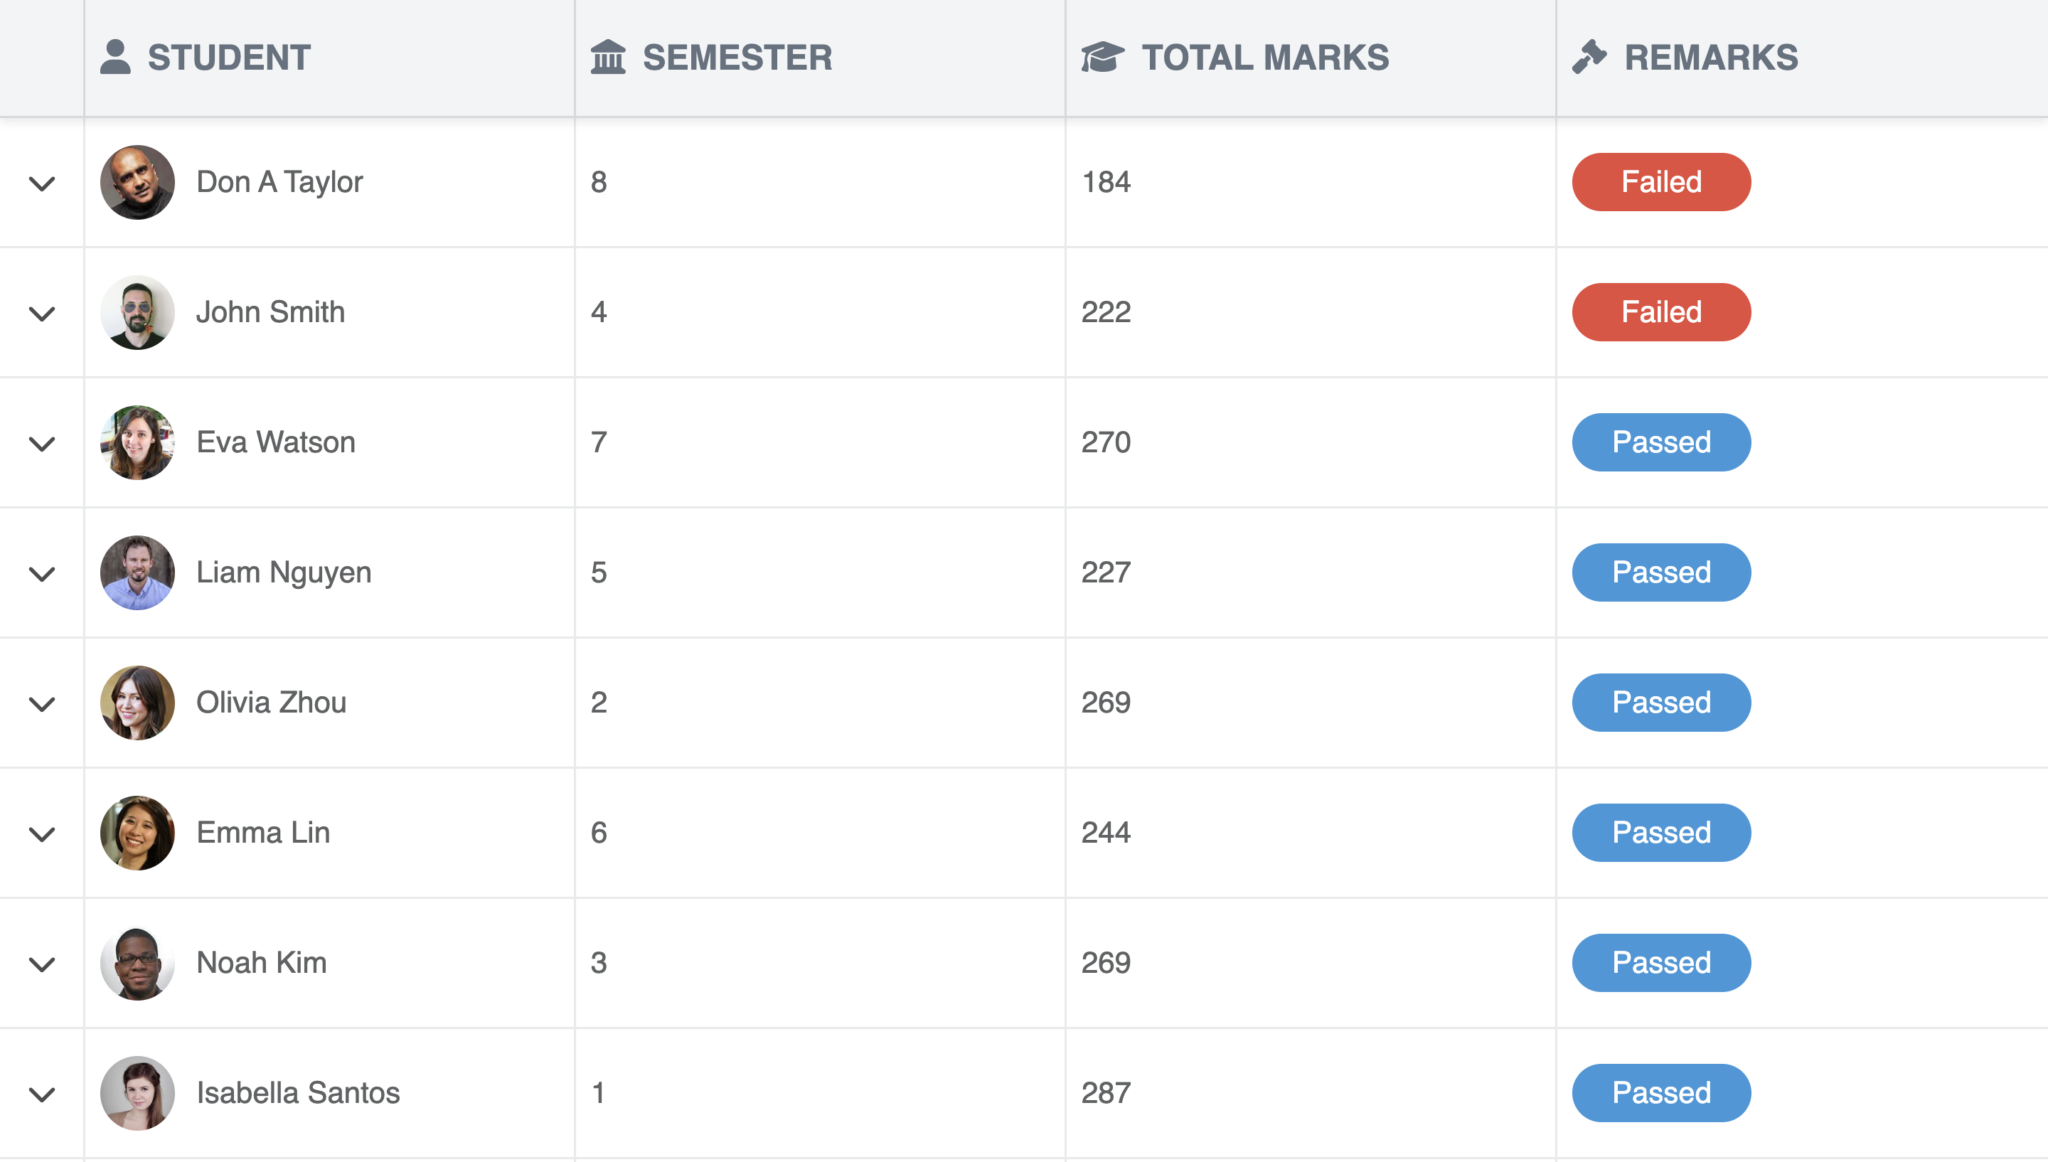
Add a column to the grid
Let’s finish the grid off by adding a “Remarks” column that will print “Passed” or “Failed” for each student, depending on their marks. If a student has a mark of less than 50 for any subject, the “Remarks” column will display “Failed”.
Add the following to the main grid column array:
{
      text: "Remarks",
      field: "remarks",
      icon: "b-fa b-fa-gavel",
      flex: 1,
},
Add the following after the imports:
const status = [
  {
    label: "Failed",
    color: "#e74c3c",
  },
  {
    label: "Passed",
    color: "#3498db",
  },
];
We generate remarks in the Students class in a similar way as we added the total:
get remarks() {
// expected to be "Passed" by default
  let currentStatus = status[1];
  this.marks.map((marks) => {
    if (marks.marks < 50) {
      currentStatus = status[0];
    }
  });
  return {
    class: "badge", // the style should be defined in .css file
    style: {
      backgroundColor: currentStatus.color,
    },
      text: currentStatus.label,
    };
  }
}
Finally, add some styling in style.css:
.badge {
  border-radius: 1em;
  padding: 0.4em 0.8em;
  color: #fff;
  text-align: center;
  min-width: 6em;
}
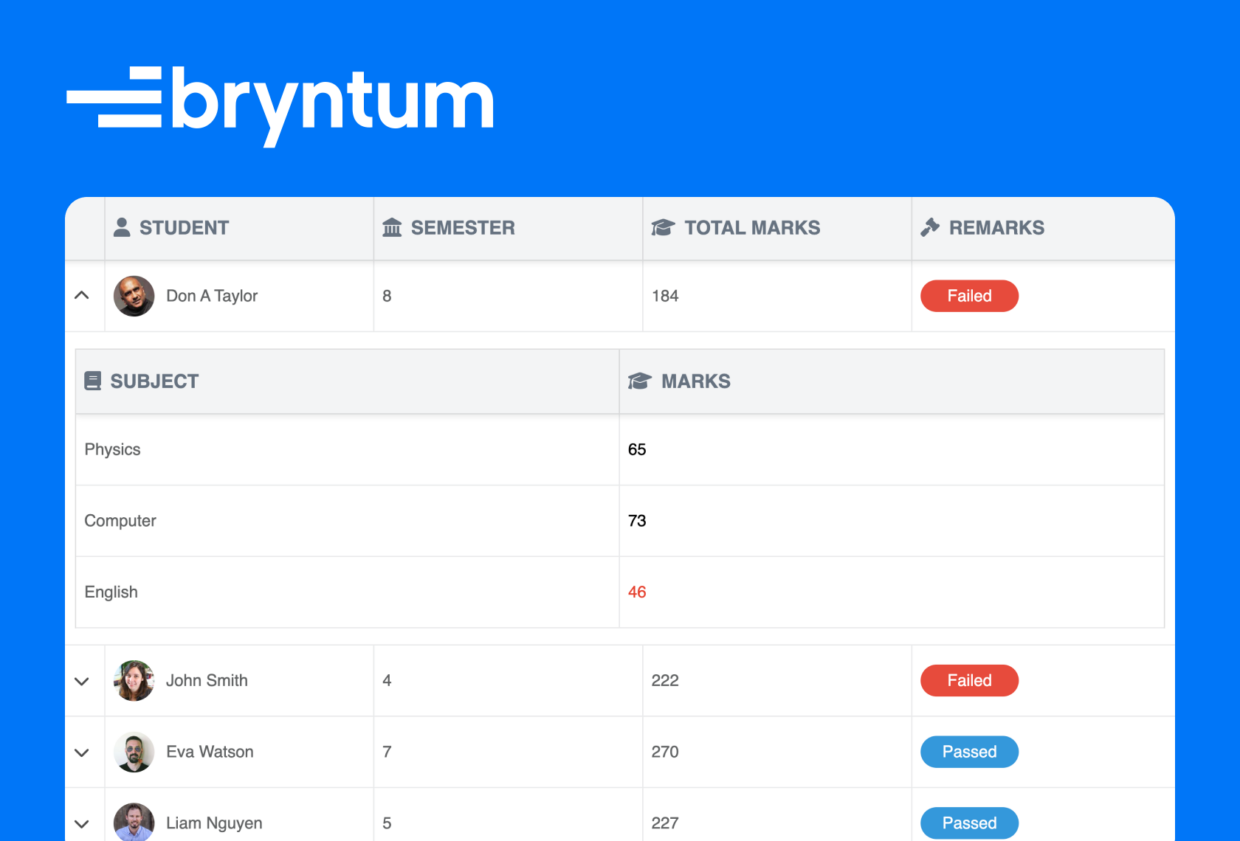
Now you should have a nested grid similar to the following.
You can also find the code of the final version here.
Next steps
We showed you how to set up a simple nested grid with Bryntum Grid, but you’ll probably want to improve on this basic design. For example, you could add buttons to the subgrid to perform operations like adding a new row at runtime. See this in action in this nested grid demo or master detail demo.
If you’re new to Bryntum Grid, we offer a 45-day trial, the perfect opportunity to explore the full capabilities of our tool in your projects. And remember, if you have any questions or need support along the way, our forums are always open.
Build it with Bryntum Grid
Start a free trial, explore live demos, or read the docs.