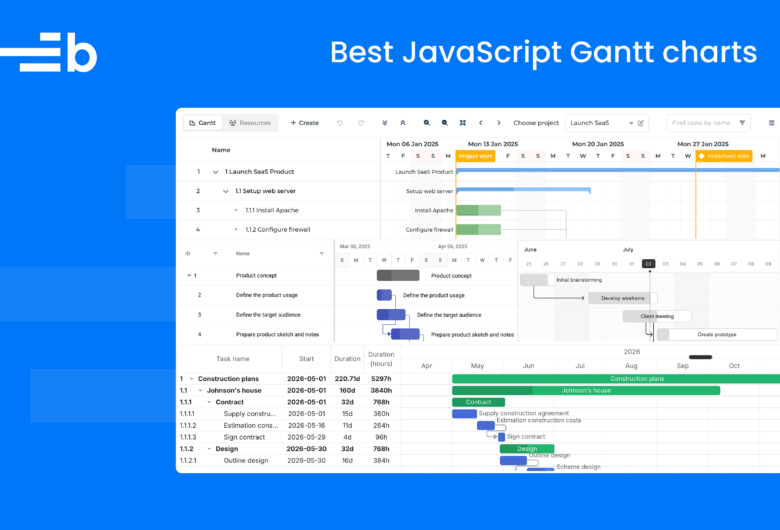
Creating a Gantt chart with Frappe Gantt
We strive to keep posts updated, but code samples may sometimes be outdated. Humans, see the Bryntum documentation; agents, https://mcp.bryntum.com for the latest info.
What is Frappe Gantt?
Frappe Gantt is an open-source JavaScript Gantt chart library. A Gantt chart is a commonly used project management tool for scheduling tasks. Frappe Gantt comes with built-in support for drag-and-drop task scheduling, task dependencies, progress tracking, and multiple view modes (day, week, month).
In this article, we’ll make a Gantt chart using Frappe Gantt, then compare it with our commercial Bryntum Gantt chart to look at the differences between building your own chart versus using an off-the-shelf solution.
The basic interactive Gantt chart that we’ll create using Frappe Gantt will have the following features:
- Tasks can be added and deleted.
- The task date can be changed using drag and drop.
- The task can be resized by clicking and dragging the sides of the taskbars.
- The tasks have a progress bar indicating task completion as a percentage.
- The Gantt chart view can be changed: day, week or month.
- The tasks can have dependencies.
- The tasks can be labeled as important, which changes the taskbar color.
We’ll also build a Gantt chart using Bryntum Gantt for comparison. Here’s what you’ll build.
The Frappe Gantt chart:
The Bryntum Gantt chart:

You can find the code for the completed Frappe Gantt chart in our GitHub repository.
Setting Up Your Gantt Chart HTML and JavaScript Project with Vite
The starter repository contains all of the files that you’ll need to create the Gantt chart. It uses Vite, which is a development server and JavaScript bundler. You’ll need Node.js version 20.19.0 or higher for Vite to work. The dependency needed for our Gantt chart is Frappe Gantt.
1. Clone the Frappe Gantt chart starter GitHub repository:
git clone https://github.com/bryntum/frappe-gantt-vanilla-js
cd frappe-gantt-vanilla-js
2. Install the dependencies:
npm install3. Run the local development server:
npm run devYou’ll see a page with the text “Loading…” in the middle of the screen.
The following Vite commands are available:
npm run devruns vite to start the dev server.npm run buildruns vite build to build the production bundle to thedistfolder.npm run previewruns vite preview to serve the production bundle.
Let’s take a look at how the Frappe Gantt chart starter code is structured.
Adding Gantt Chart Styles with CSS
The CSS we’ll use for the Gantt chart comes from two places. The Frappe Gantt library ships its own CSS, which we’ll import in main.js. Additional styles for the forms and buttons are in the styles.css file in the starter code.
Understanding the Utility Functions and Data Structure
We’ll use the native fetch API to load our example Gantt chart data, which is in the data.json file in the public/data folder.
The dateFunctions.js file in the utils folder contains a createFormattedDateFromStr function that we’ll use to format date strings. The constants.js file contains a months array that we’ll use for getting month names from their index value.
Now let’s start creating the Frappe Gantt chart component.
Creating a Basic Interactive Gantt Chart with Task Data
First, we’ll create a basic Frappe Gantt chart by fetching the tasks data from the data.json file in the public/data folder. We’ll then create a Frappe Gantt instance and pass the data to it.
Add the following code to main.js:
import Gantt from "frappe-gantt";
import "/node_modules/frappe-gantt/dist/frappe-gantt.css";

let ganttChart;
let tasks;

async function fetchData() {
  try {
    const response = await fetch("data/data.json");
    tasks = await response.json();
    ganttChart = new Gantt("#gantt", tasks, {
      bar_height: 25,
      view_mode: "Week",
    });
    showGantt();
  } catch (error) {
    showErrorMsg();
  } finally {
    hideLoader();
  }
}

function hideLoader() {
  document.getElementsByClassName("loading")[0].style.display = "none";
}

function showGantt() {
  document.getElementsByClassName("gantt-wrapper")[0].style.display = "block";
}

function showErrorMsg() {
  document.getElementsByClassName("error")[0].style.display = "flex";
}

fetchData();
We’ll store the tasks state in the tasks variable. The fetchData function will run on page load. It uses the native fetch API to get the task data from data.json, which is then passed into the created Gantt chart instance. The first argument of the Gantt constructor function is the id of the <svg> element that will contain the Gantt chart. This <svg> element is part of the starter code in the index.html file. The second argument is the data and the third argument is an options object for configuring the Gantt chart.
We set the bar_height of the taskbars and the view_mode of the calendar. On page load, the “…loading” <div> is displayed. It is then hidden using the hideLoader function in the finally block, which runs whether the fetch succeeds or fails. If there is an error, the error message <div> will be displayed. If the request is successful, the Gantt chart is shown using the showGantt function.
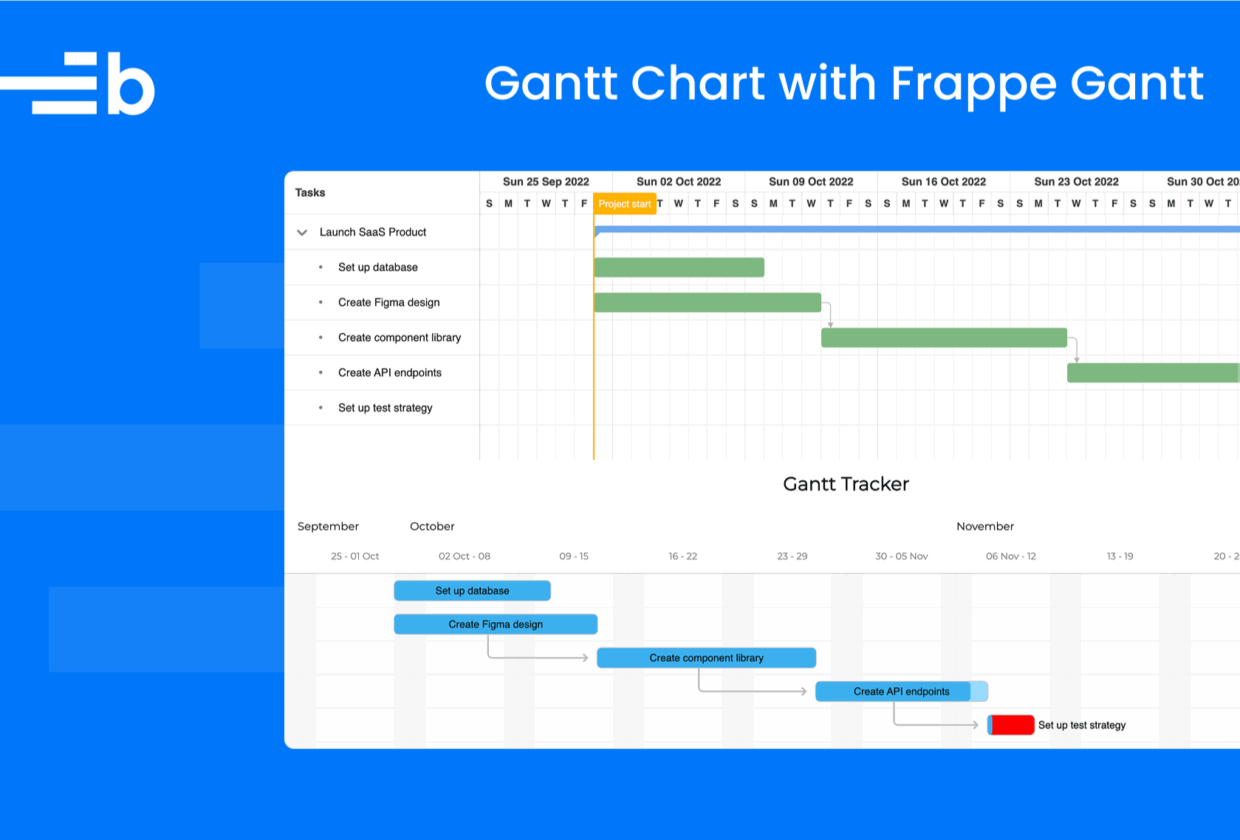
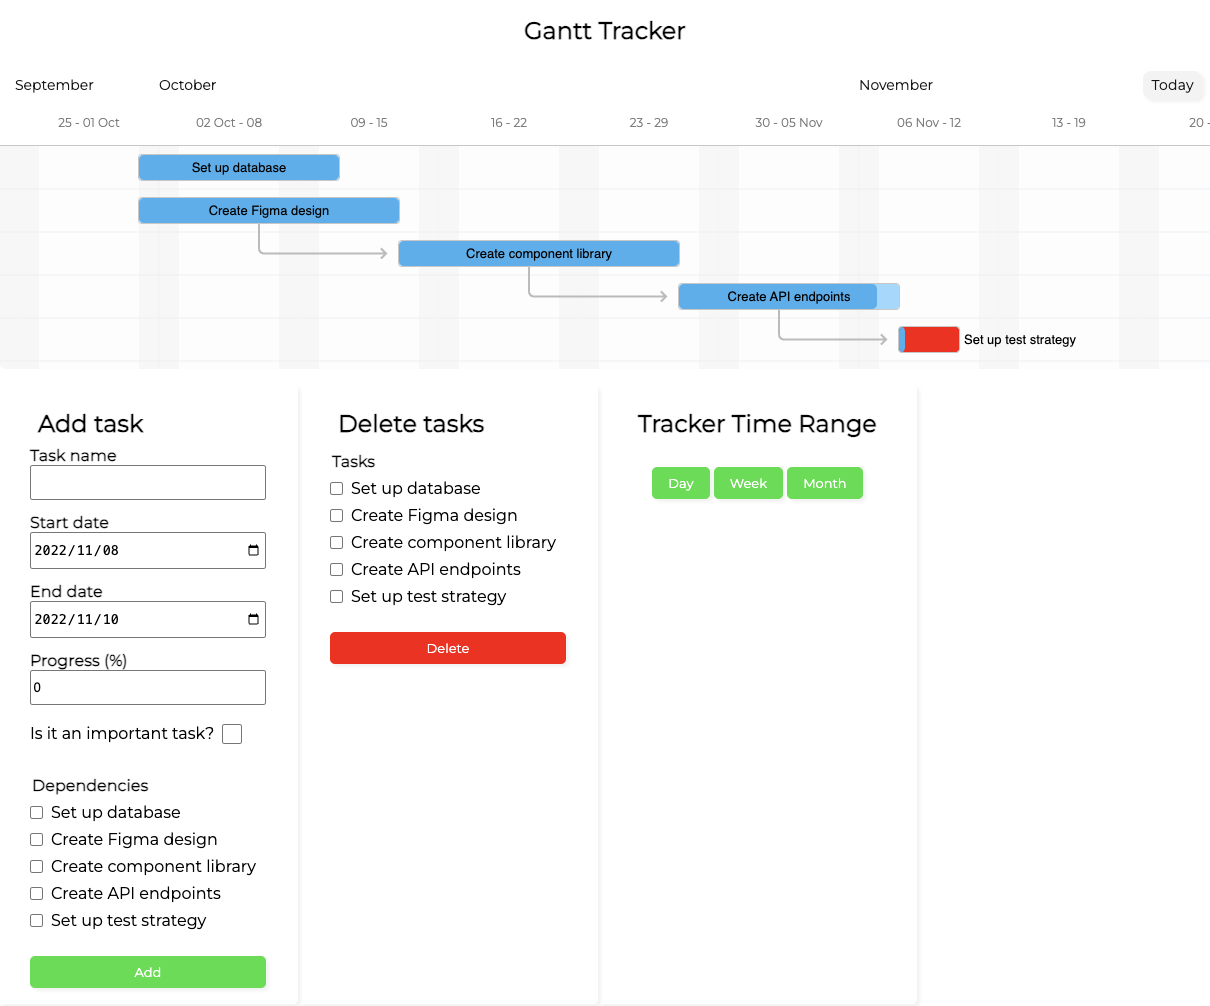
If you run your local server now, you’ll see the following Gantt chart in your browser window:
The Frappe Gantt has drag, resize, task progress display and dependencies built in, making it a solid open source Gantt chart component out of the box. The last task, “Set up test strategy”, is red because it has the custom class is-important. You can see this in the data.json file. The styling for it is in the styles.css file. Now let’s customize our Gantt chart and add more features.
Customizing the Task Tooltip
We’re going to customize the tooltip that’s displayed when you click a taskbar.
1. In main.js, add the following property in the Gantt chart constructor function’s options argument, below the view_mode property:
custom_popup_html: function (task) {
const start_day = task._start.getDate();
const start_month = months[task._start.getMonth()];
const end_day = task._end.getDate();
const end_month = months[task._end.getMonth()];
return `
<div class='details-container'>
<h5>${task.name}</h5>
<br>
<p>Task started on: ${start_day} ${start_month}</p>
<p>Expected to finish by ${end_day} ${end_month}</p>
<p>${task.progress}% completed!</p>
</div>
`;
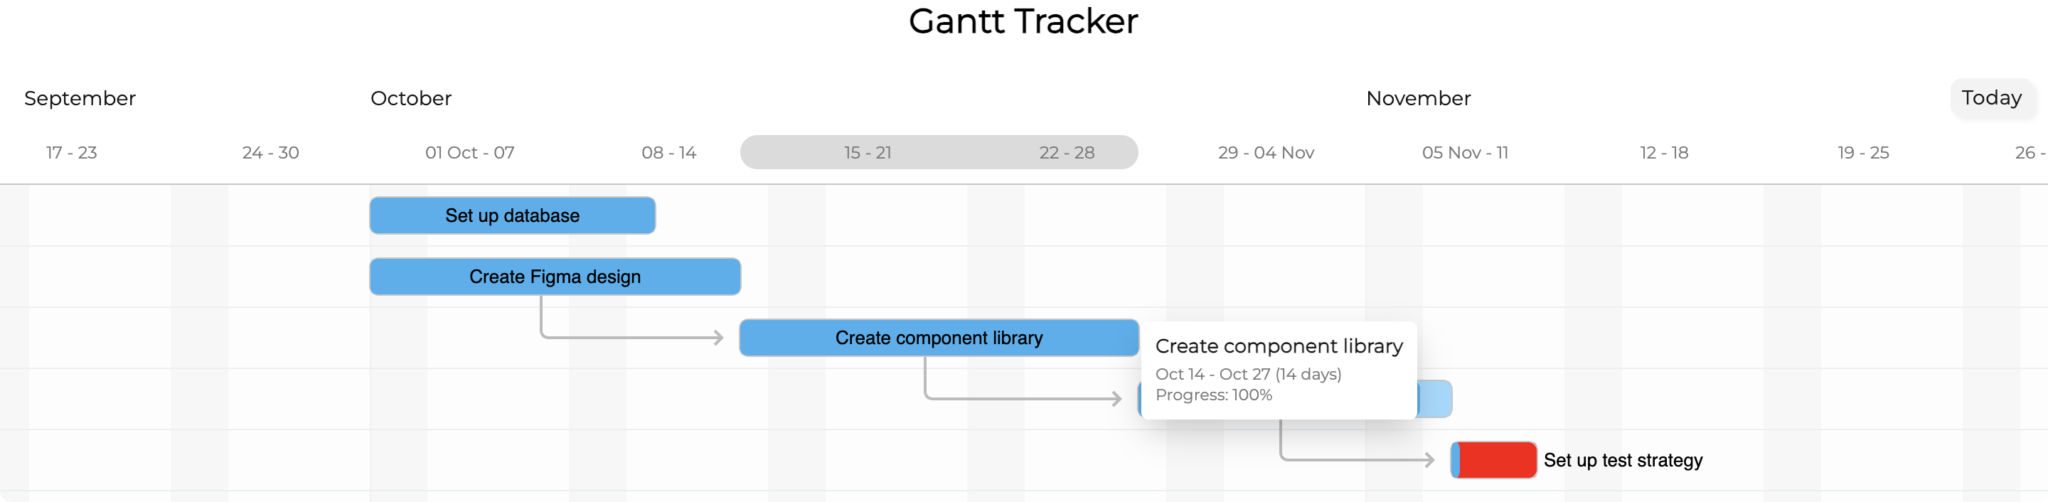
},The value of this property is a function that accepts a task as an argument. It returns a string that is displayed in the task. The “details-container” class is defined in our styles.css file. We display the task name, start date, end date and progress. If you use this in production, make sure that you sanitize the task data as creating HTML with user-supplied data is a security risk.
2. At the top of main.js, add the following import:
import { months } from "./constants.js";Now when you click a taskbar, you’ll see our custom tooltip:
Adding Tasks to Your Gantt Chart
Let’s create a form that will allow us to add new tasks.
1. In index.html, add the following HTML code as the second child of the <div> with a class of “gantt-wrapper”:
      <div id="controls-container">
        <form id="add-task">
          <h2>Add task</h2>
          <label for="task-name">Task name</label>
          <input id="task-name" name="task-name" required />

          <label for="start-date">Start date</label>
          <input
            type="date"
            id="start-date"
            name="start-date"
            value="2022-11-08"
            min="2022-01-01"
            max="2050-12-31"
          />
          <label for="end-date">End date</label>
          <input
            type="date"
            id="end-date"
            name="end-date"
            value="2022-11-10"
            min="2022-01-01"
            max="2050-12-31"
          />

          <label for="progress">Progress (%)</label>
          <input
            type="number"
            id="progress"
            name="progress"
            value="0"
            min="0"
            max="100"
          />
          <div class="important-checkbox-container">
            <label for="is-important">Is it an important task?</label>
            <input type="checkbox" id="is-important" name="is-important" />
          </div>
          <button>Add</button>
        </form>
      </div>
This form contains all of the task properties except for the dependencies. We’ll add dependency inputs later.
2. At the top of main.js, add the following line to select the “Add task” form:
const addForm = document.getElementById("add-task");3. At the bottom of main.js, add the following event listener to listen for the form submit:
addForm.addEventListener("submit", addTask);4. In main.js, add the following addTask function below the showErrorMsg function:
function addTask(e) {
  e.preventDefault();
  const formElements = e.target.elements;
  const name = formElements["task-name"].value;
  const start = formElements["start-date"].value;
  const end = formElements["end-date"].value;
  const progress = parseInt(formElements["progress"].value);
  const isImportant = formElements["is-important"].checked;

  const newtask = {
    id: `${Date.now()}`,
    name,
    start,
    end,
    progress,
    custom_class: isImportant ? "is-important" : "",
  };

  tasks.push(newtask);
  ganttChart.refresh(tasks);
}
This function gets the values from the “Add task” form, creates a new task object and then updates the tasks variable, which is the tasks state of our Gantt chart. We use the Frappe Gantt refresh method to update our Gantt chart with the new task state.
You’ll now be able to add new tasks to your Gantt chart. However, there’s a problem with updating the Gantt chart state. Try changing the date of a task by dragging or resizing it and then add a new task. After the new task is added, the task date changes back to its original value. To fix this, we’ll use two event listeners provided by Frappe Gantt: on_date_change and on_progress_change.
5. At the top of main.js, add the following import:
import { createFormattedDateFromStr } from "./utils/dateFunctions.js";6. In main.js, add the following properties in the Gantt chart constructor function’s options argument, below the custom_popup_html property:
        on_date_change: function (task, start, end) {
          updateDate(task, start, end);
        },
        on_progress_change: function (task, progress) {
          updateProgress(task, progress);
        },
The on_date_change listener accepts a callback function that’s called when a task date is changed. This function calls the updateDate function. The on_progress_change listener is called when a task progress value is changed. This function calls the updateProgress function. Let’s define the updateDate and updateProgress functions.
7. In main.js, add the following lines below the addTask function:
function updateDate(task, start, end) {
  const startYear = start.getFullYear();
  const startMonth = start.getMonth();
  const startDay = start.getDate();
  const endYear = end.getFullYear();
  const endMonth = end.getMonth();
  const endDay = end.getDate();
  const startStr = createFormattedDateFromStr(
    startYear,
    startMonth + 1,
    startDay
  );
  const endStr = createFormattedDateFromStr(endYear, endMonth + 1, endDay);

  const taskToUpdate = tasks.find((tsk) => tsk.id === task.id);
  taskToUpdate.start = startStr;
  taskToUpdate.end = endStr;
  ganttChart.refresh(tasks);
}

function updateProgress(task, progress) {
  const taskToUpdate = tasks.find((tsk) => tsk.id === task.id);
  taskToUpdate.progress = progress;
  ganttChart.refresh(tasks);
}
The updateDate function uses the passed-in date arguments as well as our createFormattedDateFromStr utility function to get the new start and end date strings of the task. We then update the tasks state and refresh the Gantt chart with the new state.
The updateProgress function is similar to the updateDate function. We update the task progress, which does not require formatting like updating the start and end dates.
Adding Task Dependencies to Your Gantt Chart Component
In our Gantt chart, most of the tasks from the data.json file have tasks that they are dependent on. This is indicated by arrows that point from the dependency to the task. Let’s add dependency inputs to our “Add task” form.
1. In index.html, add the following HTML code just above the <button>Add</button> line:
          <fieldset class="tasks-checkbox-container">
            <legend>Dependencies</legend>
          </fieldset>
2. At the top of main.js, add the following variable:
const tasksCheckboxContainers = document.querySelectorAll(
  ".tasks-checkbox-container"
);
We use querySelectorAll because we’ll add a similar task checkbox container in the “Delete tasks” form that we’ll create later.
3. In main.js, add the following function below the updateProgress function:
function addTaskCheckboxes() {
  tasksCheckboxContainers.forEach((container, i) => {
    container.innerHTML = "";
    const fragment = new DocumentFragment();
    const legend = document.createElement("legend");
    if (i === 0) {
      legend.appendChild(document.createTextNode("Dependencies"));
    } else {
      legend.appendChild(document.createTextNode("Tasks"));
    }
    fragment.appendChild(legend);
    tasks.map((task) => {
      const div = document.createElement("div");
      const checkbox = document.createElement("input");
      checkbox.type = "checkbox";
      checkbox.id = `${i}-${task.id}`;
      checkbox.name = "task";
      checkbox.value = task.id;

      const label = document.createElement("label");
      label.htmlFor = `${i}-${task.id}`;
      label.appendChild(document.createTextNode(task.name));
      div.appendChild(checkbox);
      div.appendChild(label);
      fragment.appendChild(div);
    });
    container.appendChild(fragment);
  });
}
This function is used to dynamically create checkboxes for all of the dependencies, which are the tasks. For each task, we create a checkbox <input> element. We then append the checkboxes to the form <fieldset> element.
Now we need to update the addTask function so that we can add dependencies to a new task.
4. In main.js, add the following lines below the const isImportant = formElements["is-important"].checked; line in the addTask function:
 const taskCheckboxes = formElements["task"];

  const timeDiff = new Date(end).getTime() - new Date(start).getTime();
  if (timeDiff <= 0) return;

  const depIds = [];
  if (tasks.length === 0 || !taskCheckboxes) {
    // no existing tasks, no dependencies to add
  } else if (tasks.length === 1) {
    if (taskCheckboxes.checked) {
      depIds.push(taskCheckboxes.value);
    }
  } else {
    taskCheckboxes.forEach((dep) => {
      if (dep.checked) {
        depIds.push(dep.value);
      }
    });
  }
5. In main.js, add the following property to the newTask object:
dependencies: depIds.join(", "),6. In main.js, add the following line below the ganttChart.refresh(tasks); line in the addTask function:
addTaskCheckboxes();The timeDiff variable is a check to make sure that the user does not select an invalid input range. The depIds array stores the id values of the checked dependencies. We loop through the taskCheckboxes and add the task ID if the checkbox is checked. We then add the dependencies as a property to the newTask object.
After the Gantt chart is refreshed with the new tasks, we call the addTaskCheckboxes function so that the dependency checkboxes are updated. You’ll see that at the start of the addTaskCheckboxes function, the checkboxes <fieldset> container is cleared before adding the new dependencies by setting the innerHTML to an empty string.
7. In main.js, add the following function call below the showGantt() line in the fetchData function:
addTaskCheckboxes();You’ll now be able to add dependencies to your new tasks:
Deleting Tasks from Your Gantt Chart
Let’s create a form that will allow us to delete tasks.
1. In index.html, add the following “Delete tasks” form below the “Add task” form:
        <form id="delete-tasks">
          <h2>Delete tasks</h2>
          <fieldset class="tasks-checkbox-container">
            <legend>Tasks</legend>
          </fieldset>
          <button>Delete</button>
        </form>
We’ll create a dynamic group of checkboxes like we did with the “Add tasks” form dependencies.
2. At the top of main.js, add the following variable:
const deleteForm = document.getElementById("delete-tasks");3. In main.js, add the following deleteTasks function below the addTask function:
function deleteTasks(e) {
  e.preventDefault();

  const formElements = e.target.elements;
  const taskCheckboxes = formElements["task"];
  const taskIds = [];
  if (!taskCheckboxes) return;
  if (tasks.length === 1) {
    if (taskCheckboxes.checked) taskIds.push(taskCheckboxes.value);
  } else {
    taskCheckboxes.forEach((task) => {
      if (task.checked) taskIds.push(task.value);
    });
  }
  if (taskIds.length === 0) return;

  // remove deleted tasks
  const filteredTasks = tasks.filter((task) => !taskIds.includes(task.id));

  // remove deleted dependencies
  const newTasks = filteredTasks.map((tsk) => {
    if (tsk.dependencies.length === 0) {
      return tsk;
    }

    const depsArr = tsk.dependencies;
    const newDeps = depsArr.filter((dep) => !taskIds.includes(dep));

    return {
      ...tsk,
      dependencies: newDeps,
    };
  });

  tasks = newTasks;
  ganttChart.refresh(tasks);
  addTaskCheckboxes();
}
This function gets the tasks to delete from the checkboxes that were checked in the “Delete tasks” form and stores their task IDs in the taskIds variable. We loop through the tasks variable and remove the deleted tasks. We then loop through these tasks and remove any dependencies that no longer exist. We then update the Gantt chart with the new tasks state using the refresh method.
4. At the bottom of main.js, add the following event listener:
deleteForm.addEventListener("submit", deleteTasks);You’ll now be able to delete tasks.
Changing View Modes in Your Gantt Chart
The last feature that we’ll add to our Frappe Gantt chart will be some buttons that will allow us to change the time range view of the Gantt chart.
1. In index.html, add the following lines below the “Delete tasks” form:
        <div class="chart-controls">
          <h2>Tracker Time Range</h2>
          <div class="button-container">
            <button id="day-btn">Day</button>
            <button id="week-btn">Week</button>
            <button id="month-btn">Month</button>
          </div>
        </div>
2. In main.js, add the following function below the addTaskCheckboxes function:
function addViewModes() {
  document.getElementById("day-btn").addEventListener("click", () => {
    ganttChart.change_view_mode("Day");
  });
  document.getElementById("week-btn").addEventListener("click", () => {
    ganttChart.change_view_mode("Week");
  });
  document.getElementById("month-btn").addEventListener("click", () => {
    ganttChart.change_view_mode("Month");
  });
}
This function selects the buttons and adds “click” event listeners to them that change the Gantt chart’s view mode.
3. In main.js, add the following function call inside the fetchData function, below the addTaskCheckboxes(); line:
addViewModes();Now if you click one of the buttons, the time range view will change.
We’ve completed our basic Frappe Gantt chart, but the process was a little tedious and the library is a bit buggy. Now let’s create a Gantt chart using our Bryntum Gantt JavaScript component for comparison.
Creating a Gantt chart using Bryntum
We’ve completed our Frappe Gantt chart. Now let’s see how the same result compares when using Bryntum Gantt, a commercial off-the-shelf Gantt component. Where Frappe Gantt required us to hand-code task management, view switching, and form handling, Bryntum Gantt ships all of that, and more, out of the box.
The starter repository contains all of the files that you’ll need to create the Gantt chart. It also uses Vite. To install Bryntum Gantt with npm, you’ll just need to install one library with zero external dependencies. If you are unfamiliar with Bryntum products, you can follow the guide to installing the Gantt chart component using npm.
1. Clone the Bryntum Gantt chart starter GitHub repository:
git clone https://github.com/bryntum/bryntum-gantt-vanilla-js
cd bryntum-gantt-vanilla-js
2. Install the dependencies:
npm install3. Run the local development server:
npm run devYou’ll see a blank page.
The styles.css file contains some basic styling for the Gantt chart. We set the <HTML> and <body> elements to have a height of 100vh so that the Bryntum Gantt chart will take up the full height of the screen. We also have custom styling for important tasks using the is-important class, as we did with the Frappe Gantt.
The data for the Gantt chart is in the data.json file in the public/data folder. There is one important task in the data. It has a cls property value of is-important. This is a custom CSS class.
The data is similar to the Frappe Gantt data. There is a parent row called “Launch SaaS Product” that contains the tasks data. This row is expandable. This feature is especially useful if there is a lot of data.
Now let’s create a simple Bryntum Gantt chart.
4. Add the following CSS imports to the top of styles.css:
@import "@bryntum/gantt/fontawesome/css/fontawesome.css";
@import "@bryntum/gantt/fontawesome/css/solid.css";
@import "@bryntum/gantt/gantt.css";
@import "@bryntum/gantt/svalbard-light.css";
This imports the structural CSS, the Svalbard Light theme, and the FontAwesome icons used by the component. Bryntum Gantt ships several themes. You can see a demo of the available themes here.
5. Add the following lines to main.js:
import { Gantt } from "@bryntum/gantt";

const gantt = new Gantt({
  appendTo: document.body,

  project: {
    transport: {
      load: {
        url: "data/data.json",
      },
    },
    autoLoad: true,
  },

  columns: [{ type: "name", width: 250, text: "Tasks" }],
});
We import the Bryntum Gantt component and create a new Gantt instance, passing it a configuration object.
We configured the project with the transport property to populate the Gantt chart’s data stores. We’ve configured the url to load data using the load property. You can also configure the transport to sync data changes to a specific URL. For more information, you can read the project data guide in our docs.
We also created a single task column to display the tasks.
Now, when you run your development server, you’ll see the Bryntum Gantt chart:
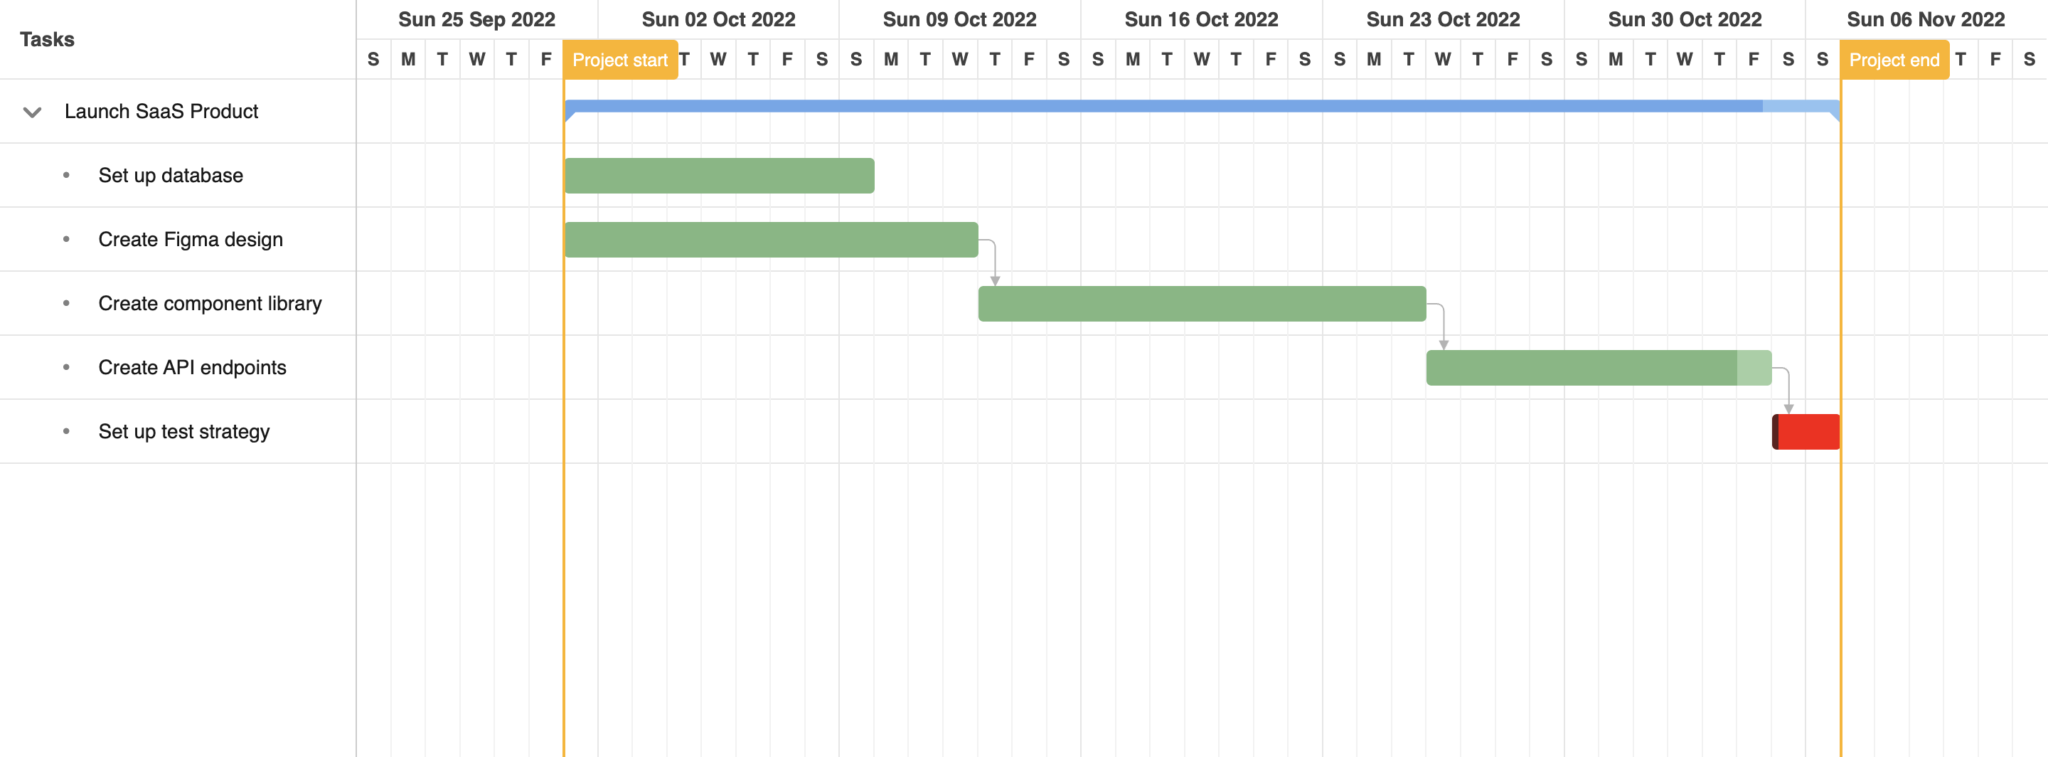
This basic example of the Bryntum Gantt component has more features by default than the Frappe Gantt chart that we created. The features include:
- Collapsible task groups.
- Drag-and-drop re-ordering of tasks.
- Add, edit, copy, and delete tasks. Right-click on a task to see a pop-up menu with these actions and more, including editing dependencies.
- Draggable task durations.
- Resizeable task durations. Hover over the left or right side of a task duration until the cursor changes to a resize icon. Then click and drag left or right.
- Create task dependencies. Hover over the left or right side of a task duration until you see a circle icon. Then click and drag to connect the task to another task.
- Filter tasks by name.
- Change date ranges.
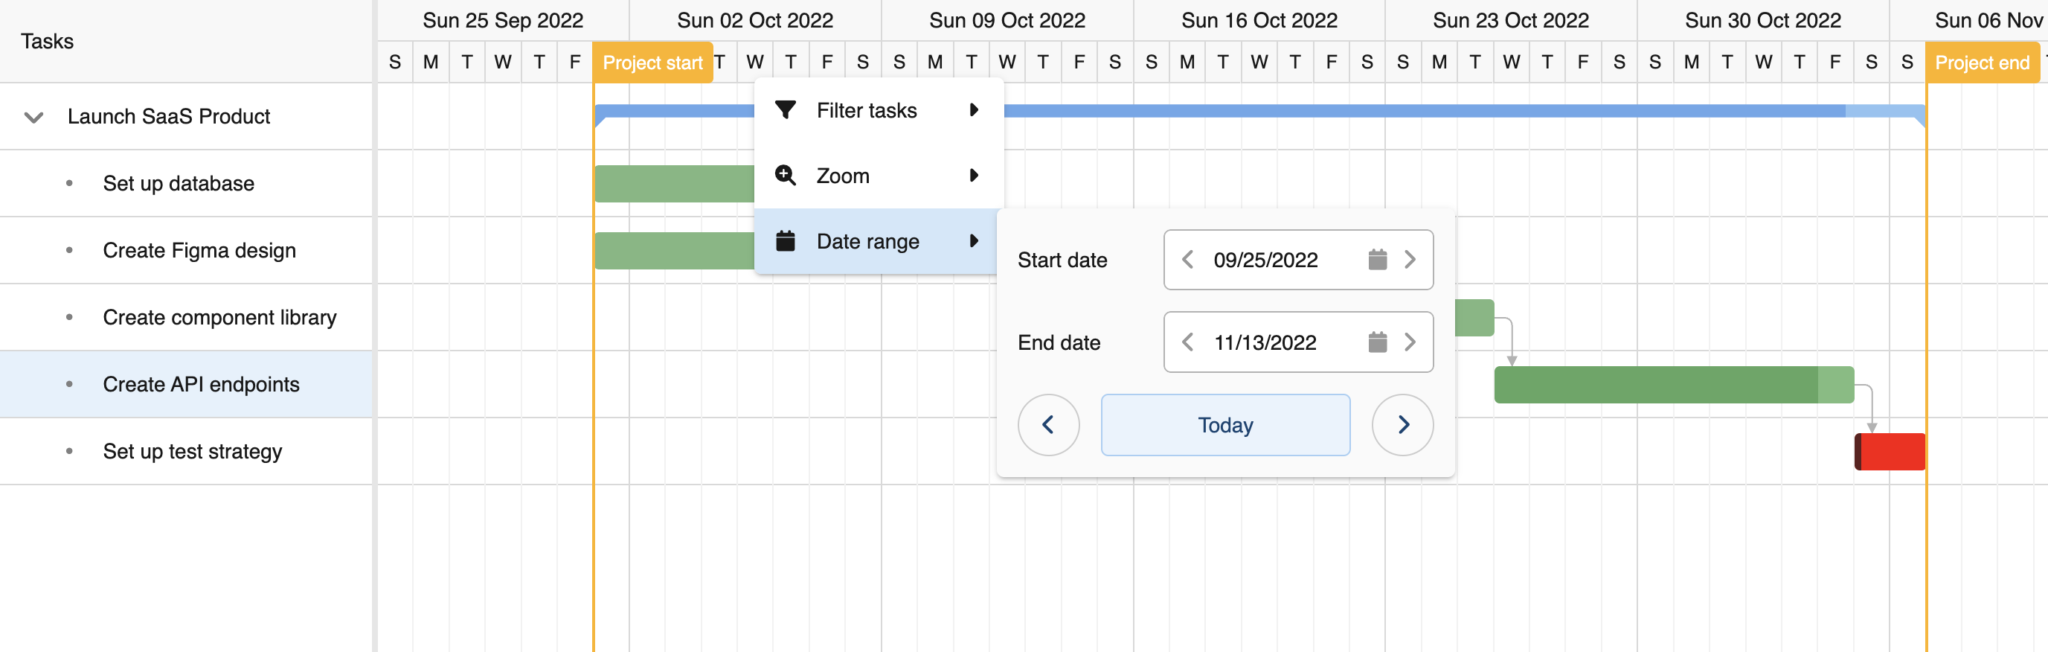
Try out some of these features in your app.
Frappe Gantt vs Bryntum Gantt
| Area | Frappe Gantt | Bryntum Gantt |
|---|---|---|
| License | Open source (MIT) | Commercial |
| Built-in interactions | Drag, resize, progress, dependencies, view modes | Drag, resize, progress, dependencies, view modes, task editing, context menus, filtering, columns, and more |
| Extra code in this tutorial | Forms, deletion, dependency inputs, view buttons, state syncing | None: the basic example includes it |
| Data format | Task objects with id, name, start, end, progress, dependencies | Project config with a data URL |
| Best fit | Lightweight charts where you own the app logic | Production apps where support and built-in features matter |
Both libraries produce a working Gantt chart. The real question is how much you want to build around it. Bryntum has task editing, filtering, context menus, and more built in.
Build or Buy? Evaluating Open Source Gantt Chart Libraries
This Gantt chart tutorial gives you a starting point for building with Frappe Gantt. If you’re instead looking to buy an off-the-shelf, battle-tested solution that just works, take a look at some examples of our Bryntum Gantt. With the Bryntum Gantt component, you can:
- Schedule tasks using dependencies and constraints.
- Leverage calendars for projects, tasks, and resources.
- Use recurrent and fixed time intervals.
- Customize rendering and styling.
- Customize user experience through many different column types and task editors.
- Deal with extensive data sets and performance tuning.
We also have a support forum and offer professional services.
Build it with Bryntum Gantt
Start a free trial, explore live demos, or read the docs.