Comparison of Sentry vs. LogRocket for error logging using a Bryntum Gantt chart
We strive to keep posts updated, but code samples may sometimes be outdated. Humans, see the Bryntum documentation; agents, https://mcp.bryntum.com for the latest info.
Error logging is critical for commercial applications. Logging errors as they happen helps developers solve issues faster, which makes for happier customers. In this tutorial, we’ll compare two major error logging and performance monitoring platforms: Sentry and LogRocket.
We’ll compare them by logging errors in a simple Bryntum Gantt chart. We’ll do the following:
- Create a Bryntum Gantt chart that has some handled and unhandled errors triggered by certain events.
- Sign up for Sentry and LogRocket and add them to the Bryntum Gantt chart frontend application.
- View the error logs on the Sentry and LogRocket websites.
- Compare Sentry and LogRocket.
Creating a basic Bryntum Gantt chart with errors triggered by certain events
We’ll start by cloning the Bryntum Gantt chart starter GitHub repository. The starter repository contains all the files you’ll need to create the Gantt chart. It has four Git branches:
maincompleted-ganttcompleted-gantt-sentrycompleted-gantt-logrocket
The app uses Vite, a development server and JavaScript bundler.
Install the dependencies with the following command:
npm installAll you need to do to install the Bryntum Gantt with npm is install one library with zero external dependencies. If you are unfamiliar with Bryntum products, you can follow the guide to installing the Bryntum Gantt chart component using npm.
The styles.css file contains some basic styling for the Gantt chart. We set the <HTML> and <body> elements to have a height of 100vh so that the Bryntum Gantt chart will take up the full height of the screen.
The data.json file in the public/data folder has example data for our Gantt chart. The example data is tasks for launching a SaaS product.
Now let’s create a simple Bryntum Gantt chart with some errors triggered by certain events. We’ll log these errors with Sentry and LogRocket. Add the following lines to the main.js file:
import { Gantt, ProjectModel } from "@bryntum/gantt";
import "@bryntum/gantt/gantt.stockholm.css";
const project = new ProjectModel({
  transport: {
    load: {
      url: "data/data.json",
    },
  },
});
project
  .load()
  .catch((error) => {
    console.error(error);
  })
  .then(() => {
    // here data is loaded and processed by the engine
    console.log("Data loaded and processed...");
  });
const gantt = new Gantt({
  appendTo: document.body,
  project,
  columns: [{ type: "name", width: 250, text: "Tasks" }],
});
Here we import the Bryntum Gantt component and the CSS for the Stockholm theme.
A theme is essential to render the Bryntum Gantt correctly, and the Stockholm theme is one of five available themes for Bryntum products. Take a look at this demo to see the different Bryntum themes. You can also create custom themes for Bryntum components.
Then we create a new Gantt instance and pass it a configuration object.
We configure the project with the transport property to populate the Gantt chart data stores and the url to load data using the load property. You can also configure the transport to sync data changes to a specific URL. For more information, read the project data guide in our docs.
We call the load method to load data from the load URL. We do this so that we can catch any data-loading errors. The Gantt chart is configured to display a single tasks column.
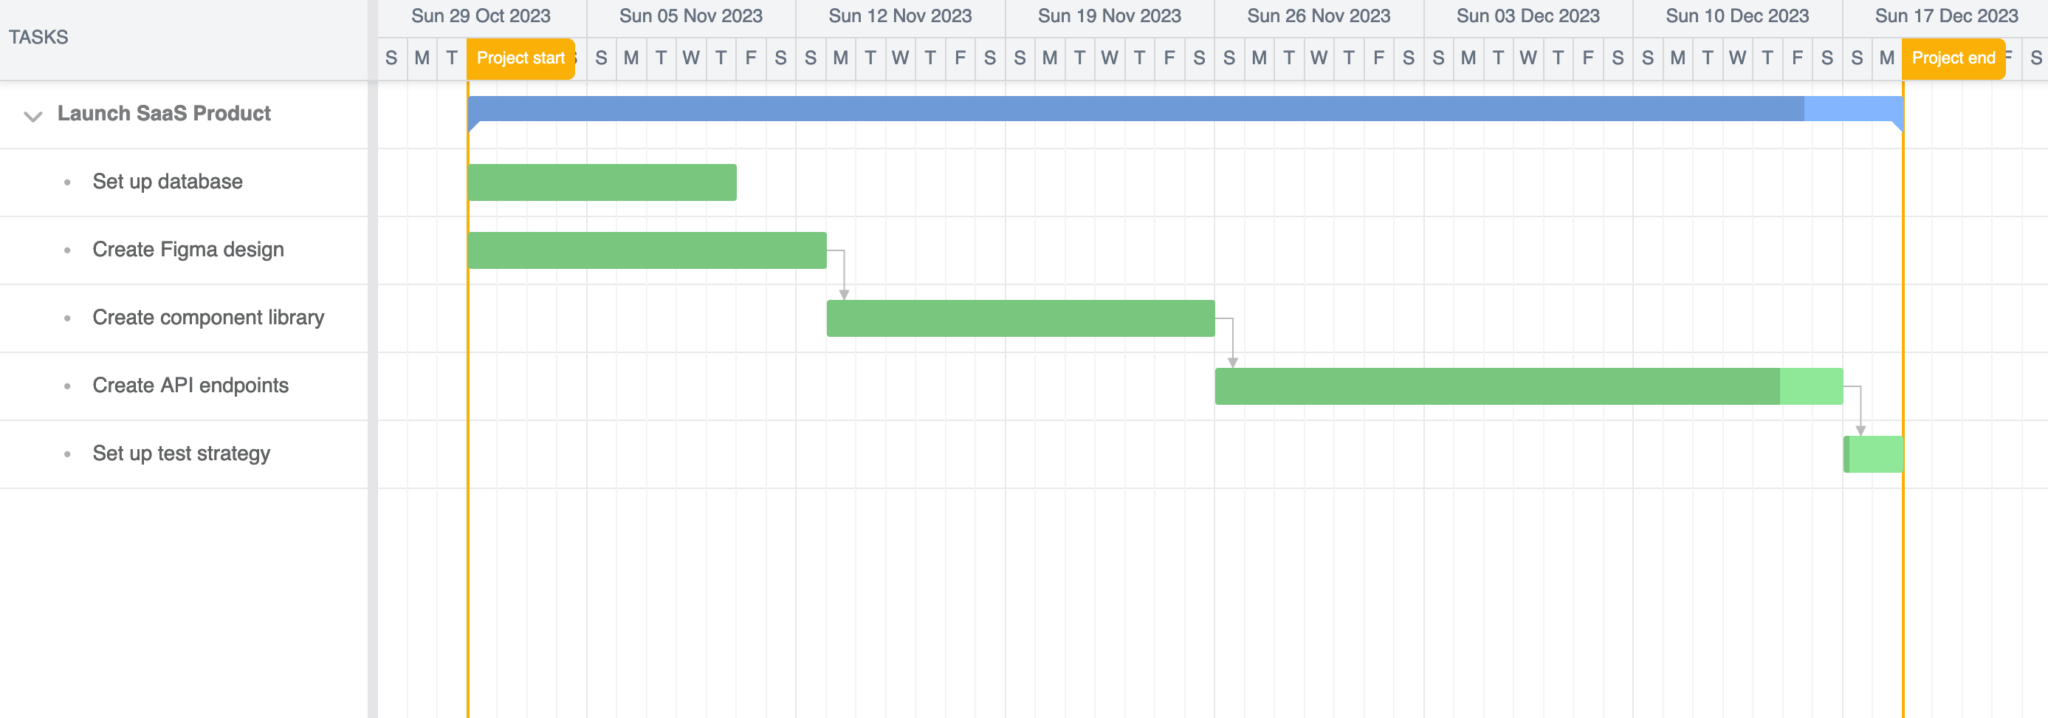
Now, when you run your development server with npm run dev, you’ll see the Bryntum Gantt chart with the example tasks data:
Next, add the following toolbar config below the columns config:
  tbar: {
    height: "4em",
    items: {
      addTaskButton: {
        color: "b-green",
        icon: "b-fa b-fa-plus",
        text: "Create",
        tooltip: "Create new task",
        onAction: "up.onAddTask",
      },
    },
  },
We add a “Create” button to the toolbar to create a new task. When the button is clicked, the onAddTask function will be called. Let’s define this method below the tbar config object:
  async onAddTask() {
    const gantt = this,
      added = gantt.taskStore.rootNode.appendChild({
        name: this.L("New task"),
        duration: 1,
      });
    // run propagation to calculate new task fields
    // correct call await gantt.project.commitAsync();
    // incorrect method name (missing an m)
    await gantt.project.comitAsync();
    // scroll to the added task
    await gantt.scrollRowIntoView(added);
    gantt.features.cellEdit.startEditing({
      record: added,
      field: "name",
    });
  },
This function adds a new task to the task store. The commitAsync method call has a spelling error. If you click on the “+ Create” button, you’ll get the following error in your browser dev tools console:
Uncaught (in promise) TypeError: gantt.project.comitAsync is not a functionWe’ll now create another example error. Add the following method below the onAddTask method:
  onPercentBarDrag({ taskRecord }) {
    if (taskRecord.percentDone === 100) {
      // send task complete notification to api using fetch
      postData("https://example.com/notifications/taskcomplete", {
        taskId: taskRecord.id,
      })
        .then((data) => {
          console.log(data);
        })
        .catch((error) => {
          console.error(error);
        });
    }
  },
This method is called when the percentBarDrag event occurs. When the percent bar is dragged to 100% done, we’ll send a POST request to an example API endpoint that logs that a task has been completed. This API endpoint does not exist so an error will occur.
Add the following postData function to the top of the file:
async function postData(url = "", data = {}) {
  const response = await fetch(url, {
    method: "POST",
    headers: {
      "Content-Type": "application/json",
    },
    body: JSON.stringify(data),
  });
  return response.json();
}
If you drag the progress bar of a task to 100% complete, you’ll get an error in your browser dev tools: TypeError: Failed to fetch.
Now, let’s add Sentry to our app to log these errors.
Adding Sentry to the Bryntum Gantt chart
We’ll first create a Sentry account. Sentry has one free developer plan with limited error and performance monitoring and three paid plans. You can learn more about these different plans on the Sentry pricing page. All new Sentry accounts come with a 14-day free trial period that gives you access to the latest features, such as comprehensive performance monitoring.
Creating a Sentry account
Sign up for Sentry on their sign-up page. Once you’ve signed up, you’ll see the onboarding steps:
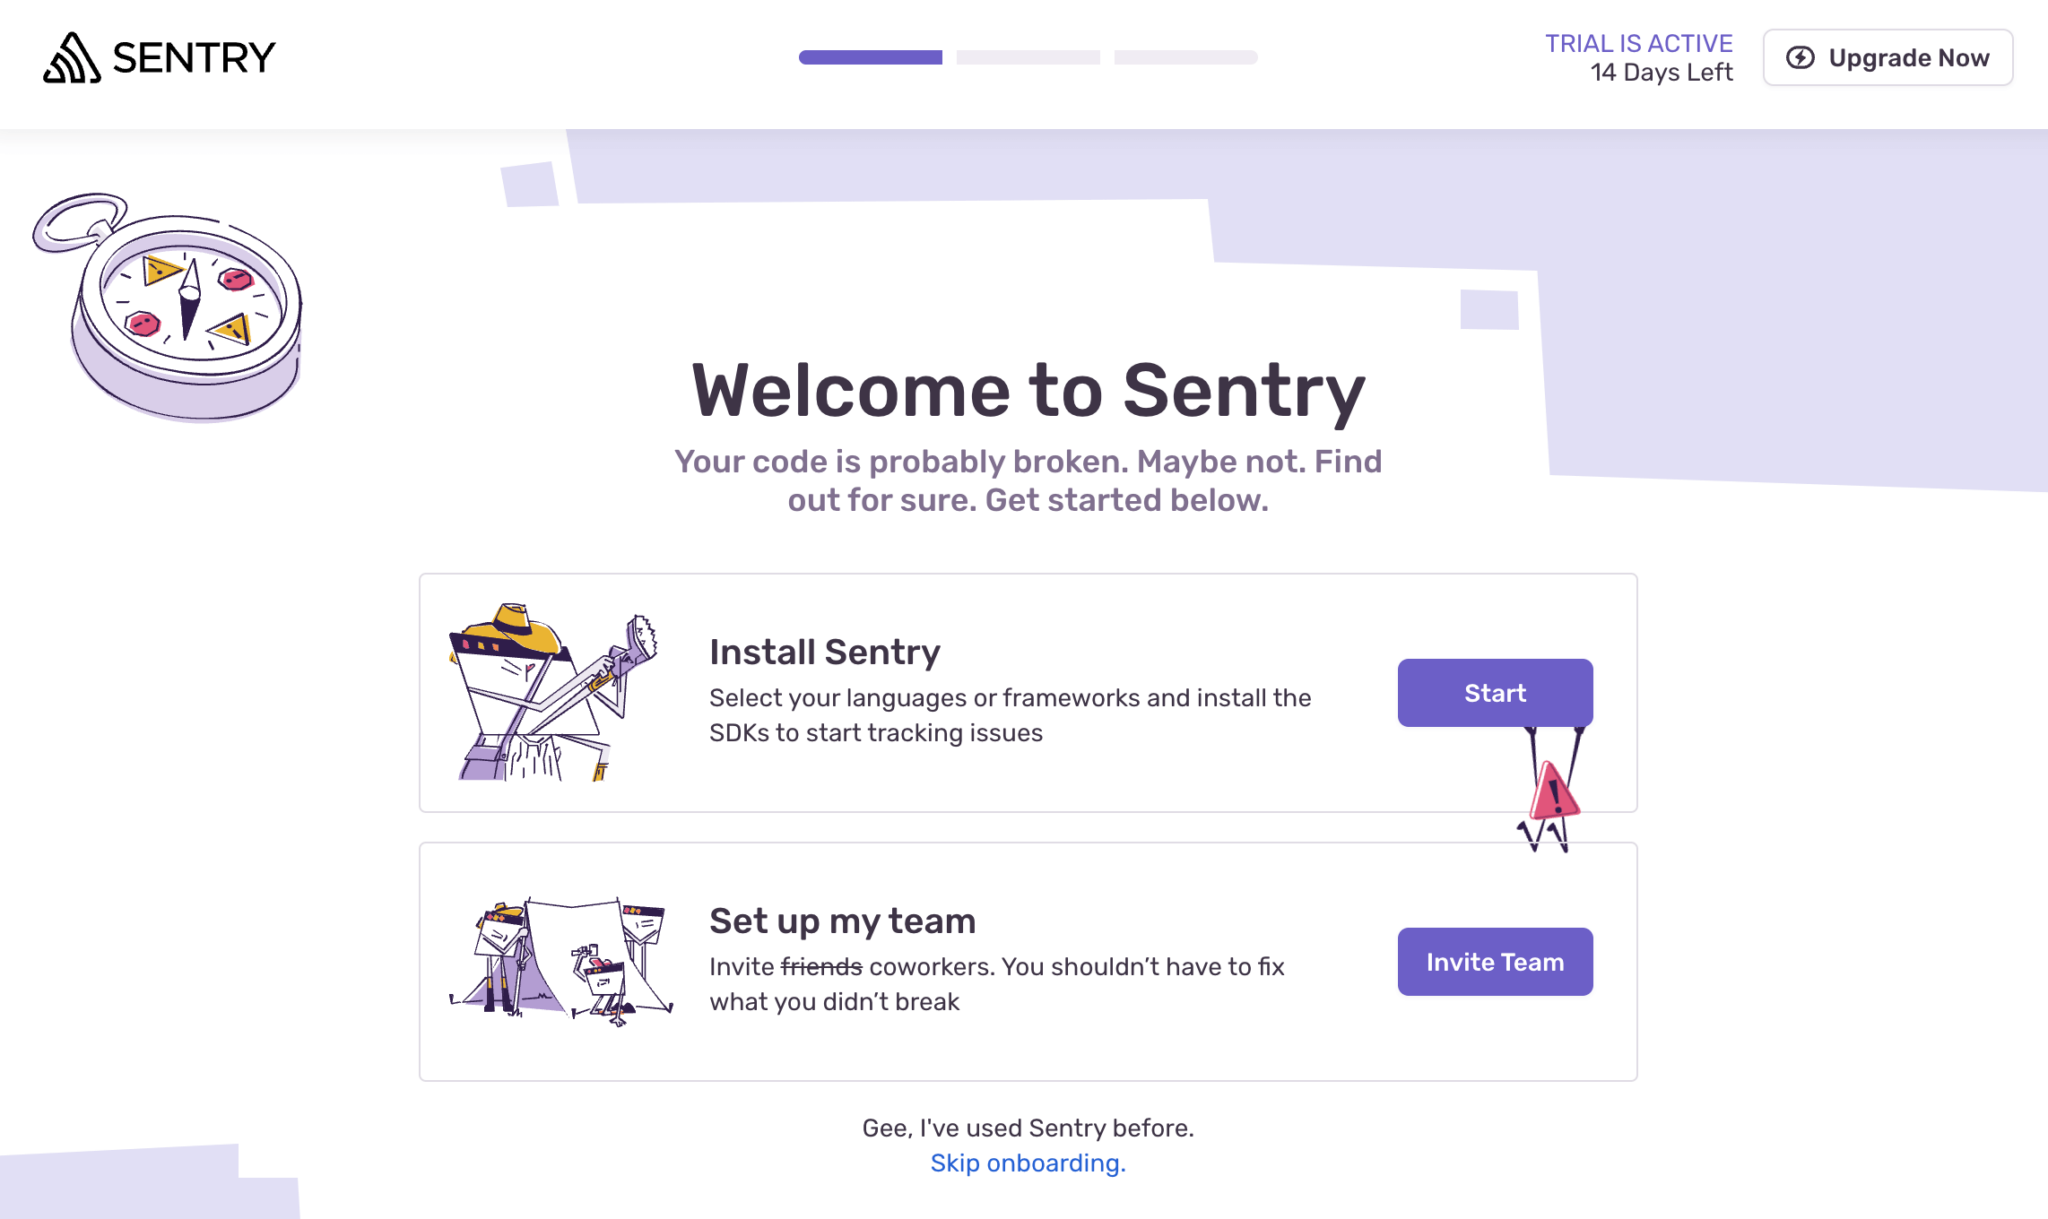
To complete the onboarding steps:
- Click the “Start” button to install Sentry.
- In the next step, select “Browser JavaScript” for the platform that you want to monitor.
- Click the “Configure SDK” button at the bottom right of the screen.
- Click the “Skip” button in the “Do you use a framework?” dialog that opens.
- In the “Configure Browser JavaScript SDK” step, we’ll use a script tag to add Sentry to our Bryntum Gantt application. Make sure that the Error Monitoring, Performance Monitoring, and Session Replay checkboxes are checked.
Add the provided script tag inside the <head> tag in your index.html file. It should look like the following script tag:
<script
src="https://js.sentry-cdn.com/<random string>.min.js"
crossorigin="anonymous"
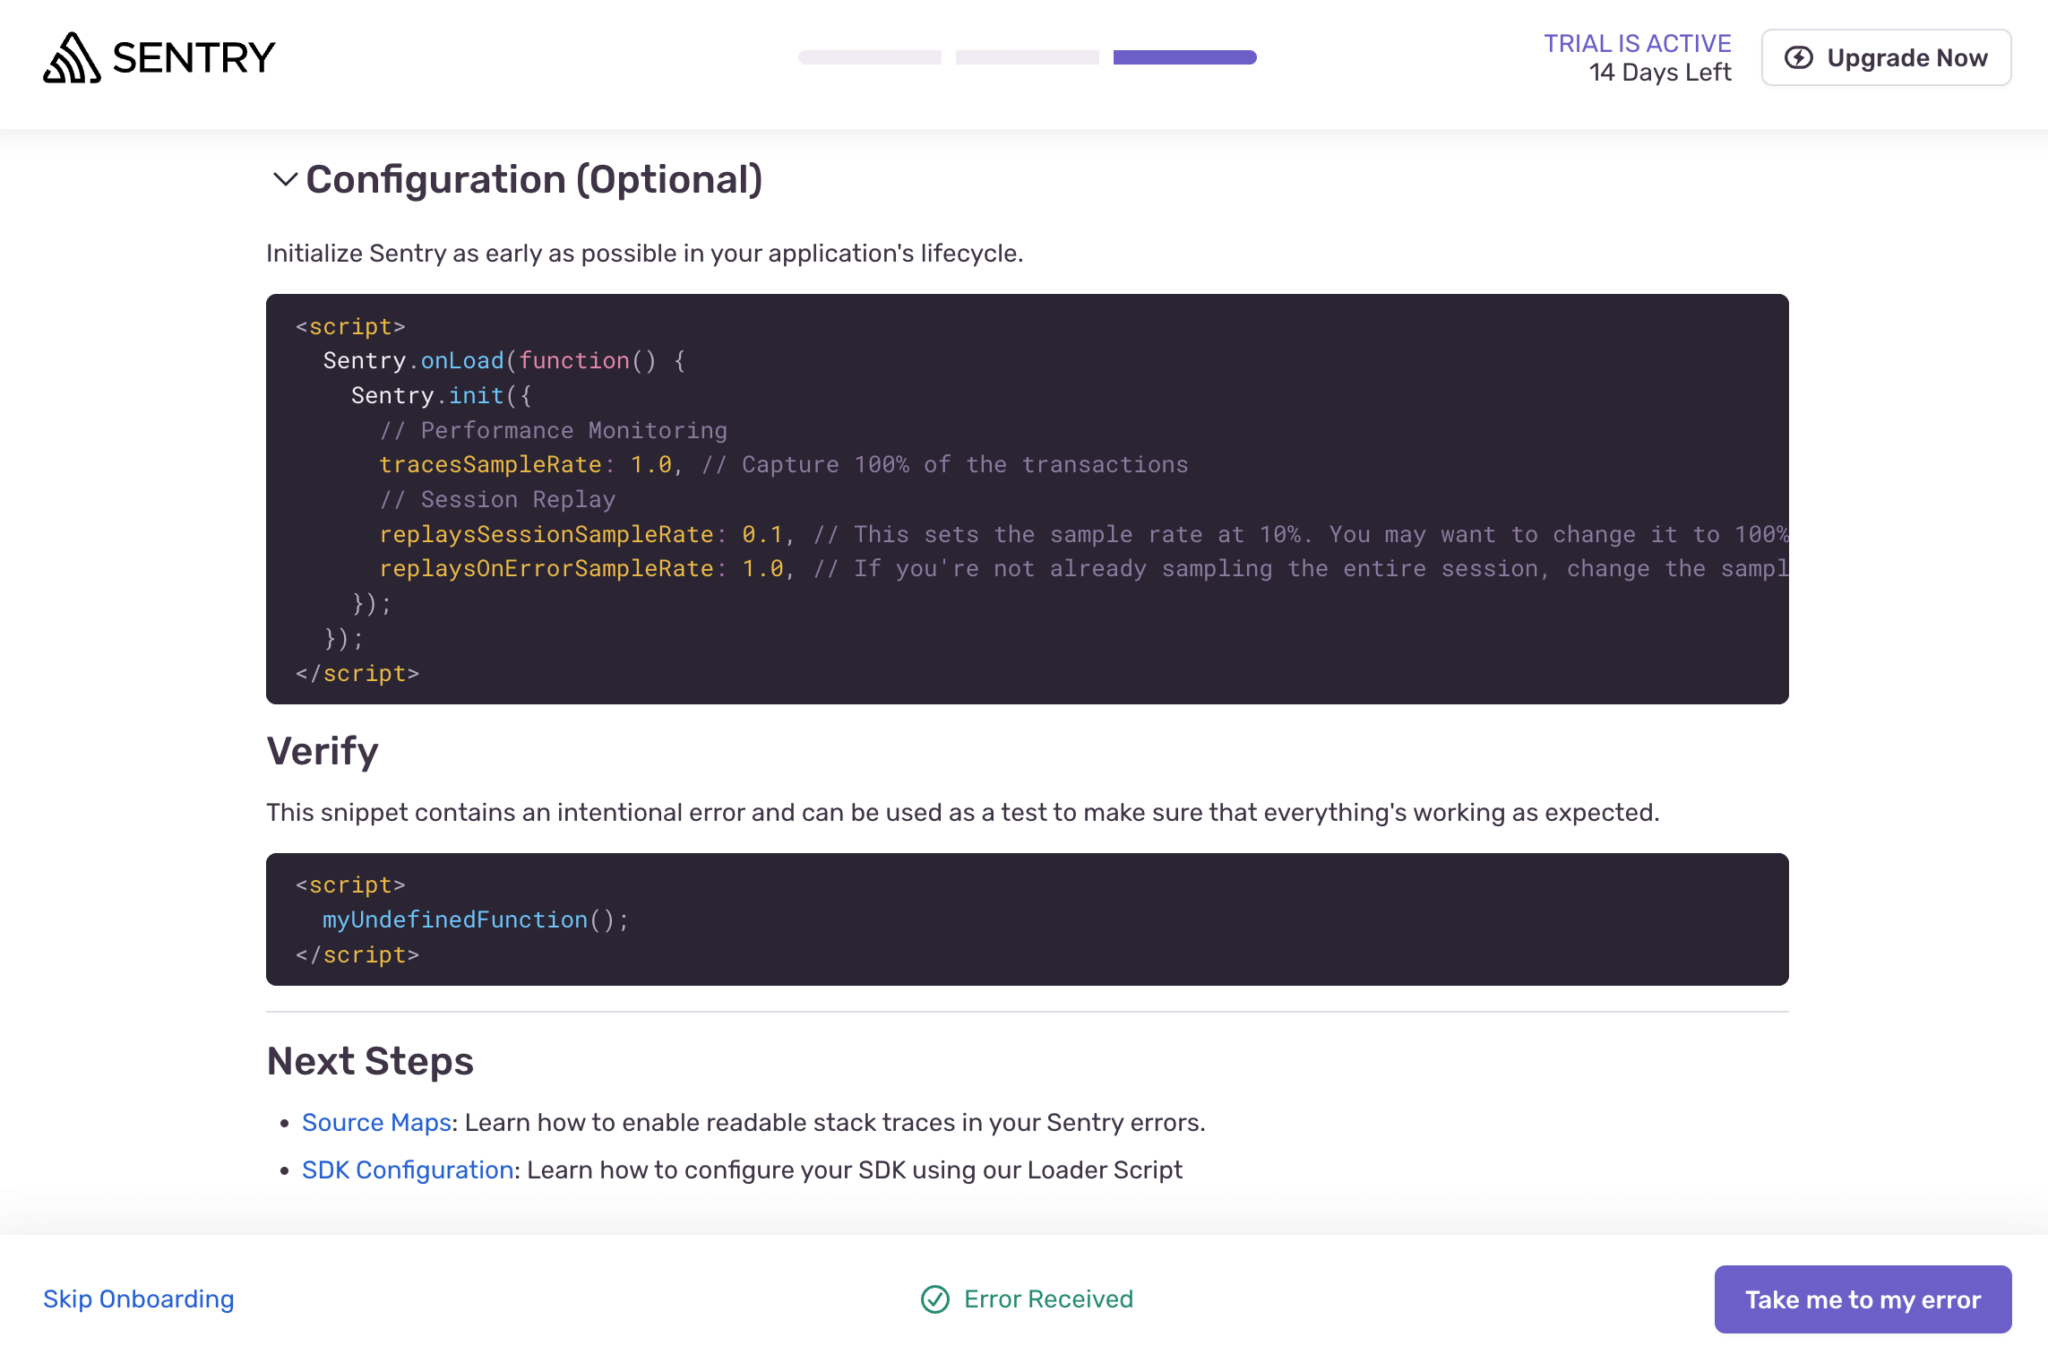
></script>We’ll now add a configuration script to initialize Sentry. Add the following script tag just above the “main.js” script tag:
    <script>
      Sentry.onLoad(function() {
        Sentry.init({
          // Performance Monitoring
          tracesSampleRate: 1.0, // Capture 100% of the transactions
          // Session Replay
          replaysSessionSampleRate: 1.0, // Sample at a lower rate in production.
          replaysOnErrorSampleRate: 1.0, // If you're not already sampling the entire session, change the sample rate to 100% when sampling sessions where errors occur.
        });
      });
    </script>
Session Replays show videos of the user’s browser with potentially sensitive information removed. Replays show what happened before, during, and after an issue occurred. During development and testing, Sentry recommends setting replaysSessionSampleRate to 1.0 so that every user session will be sent to Sentry.
Logging an unhandled error
Now run your development server and click the “+ CREATE” button in your Gantt chart toolbar to cause an unhandled error. Sentry will automatically capture this error. You’ll see an “Error Received” message at the bottom of the Sentry onboarding screen:
Note: If the Sentry script doesn’t load or if Sentry is
undefined, requests to sentry.io may be blocked by a browser extension. Try disabling your extensions or running your application in your browser’s incognito mode.
Click on the “Take me to my error” button on the bottom right of the screen.
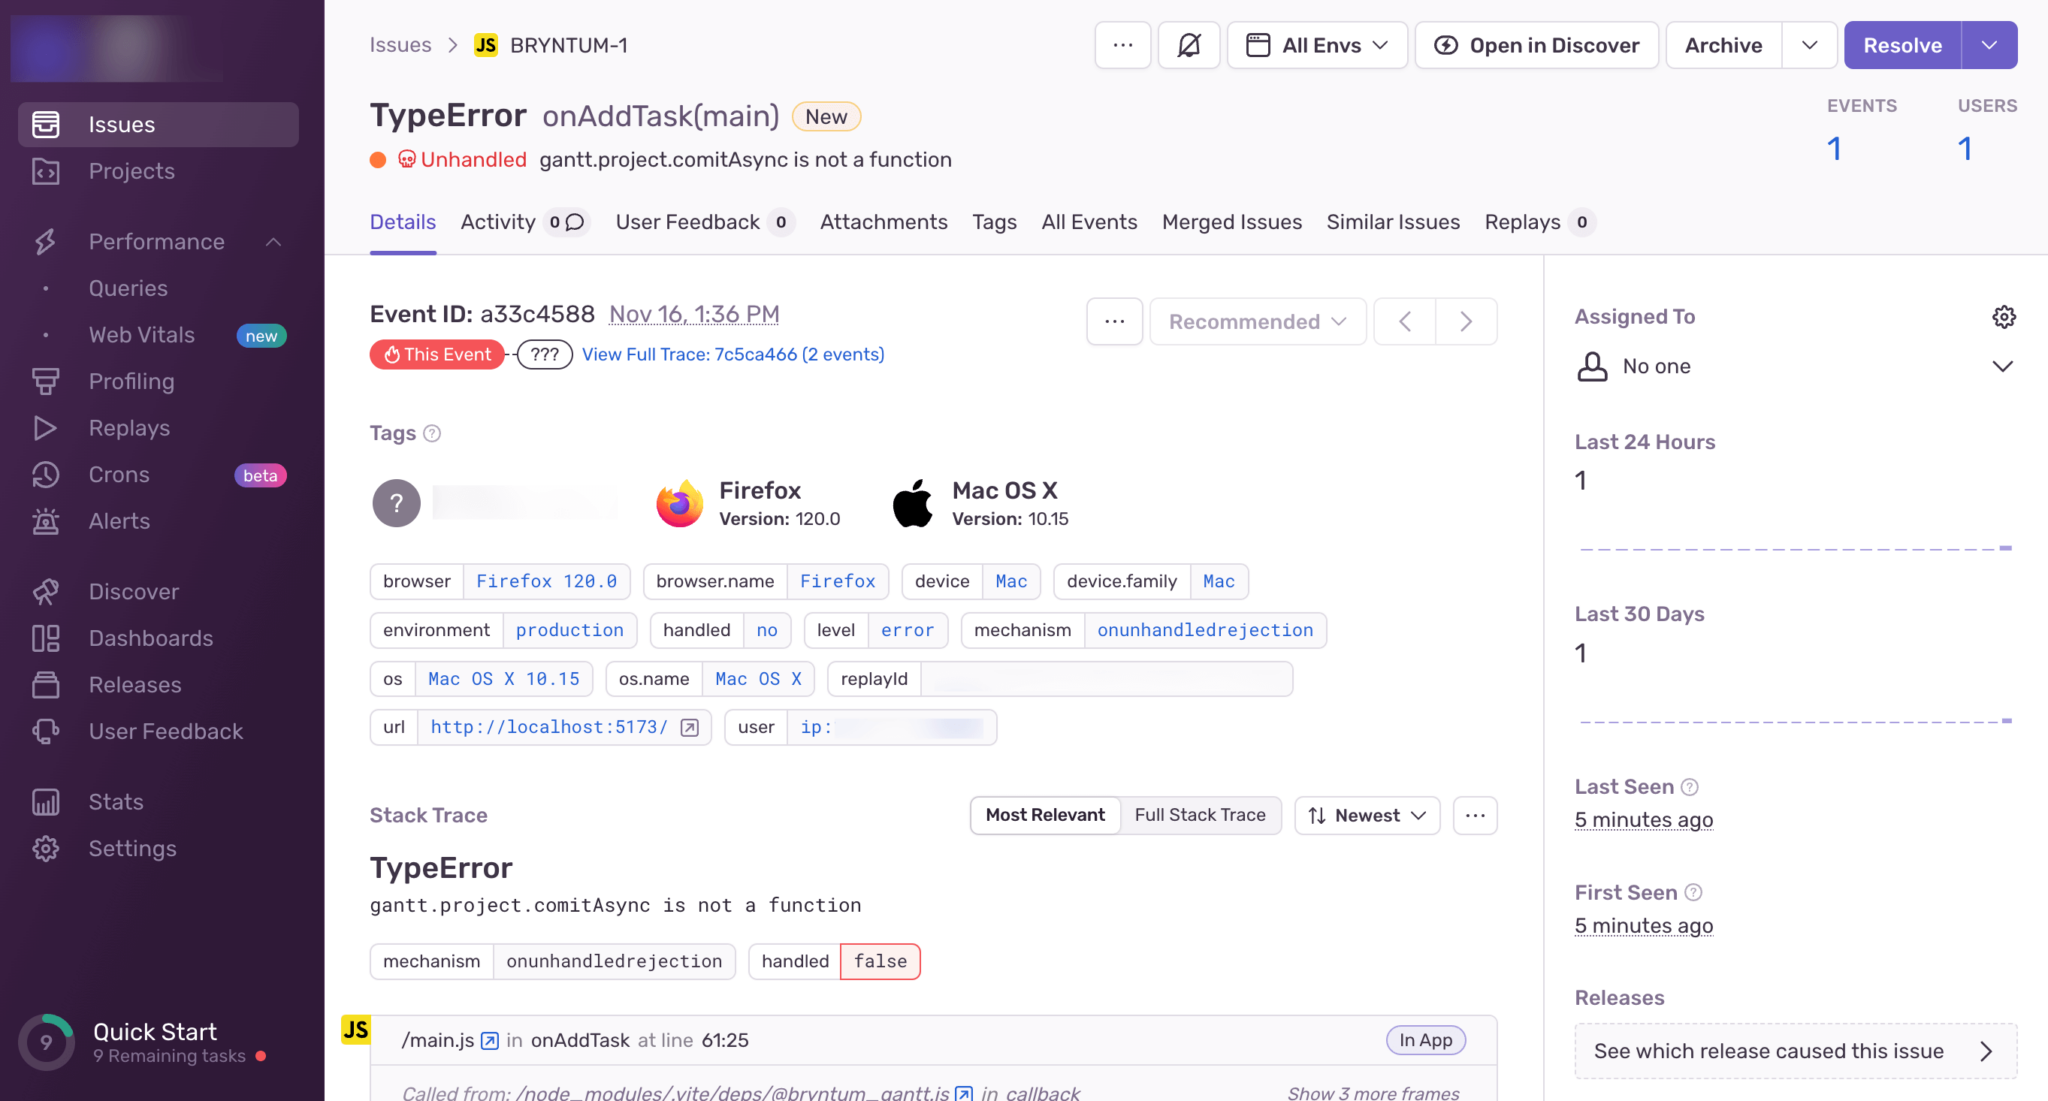
The Sentry dashboard issues page contains information about the error caused by the unhandled error, including details about the user’s browser and operating system, a stack trace, and a Session Replay.
If you scroll down, you’ll see breadcrumbs of the events that led up to the error:
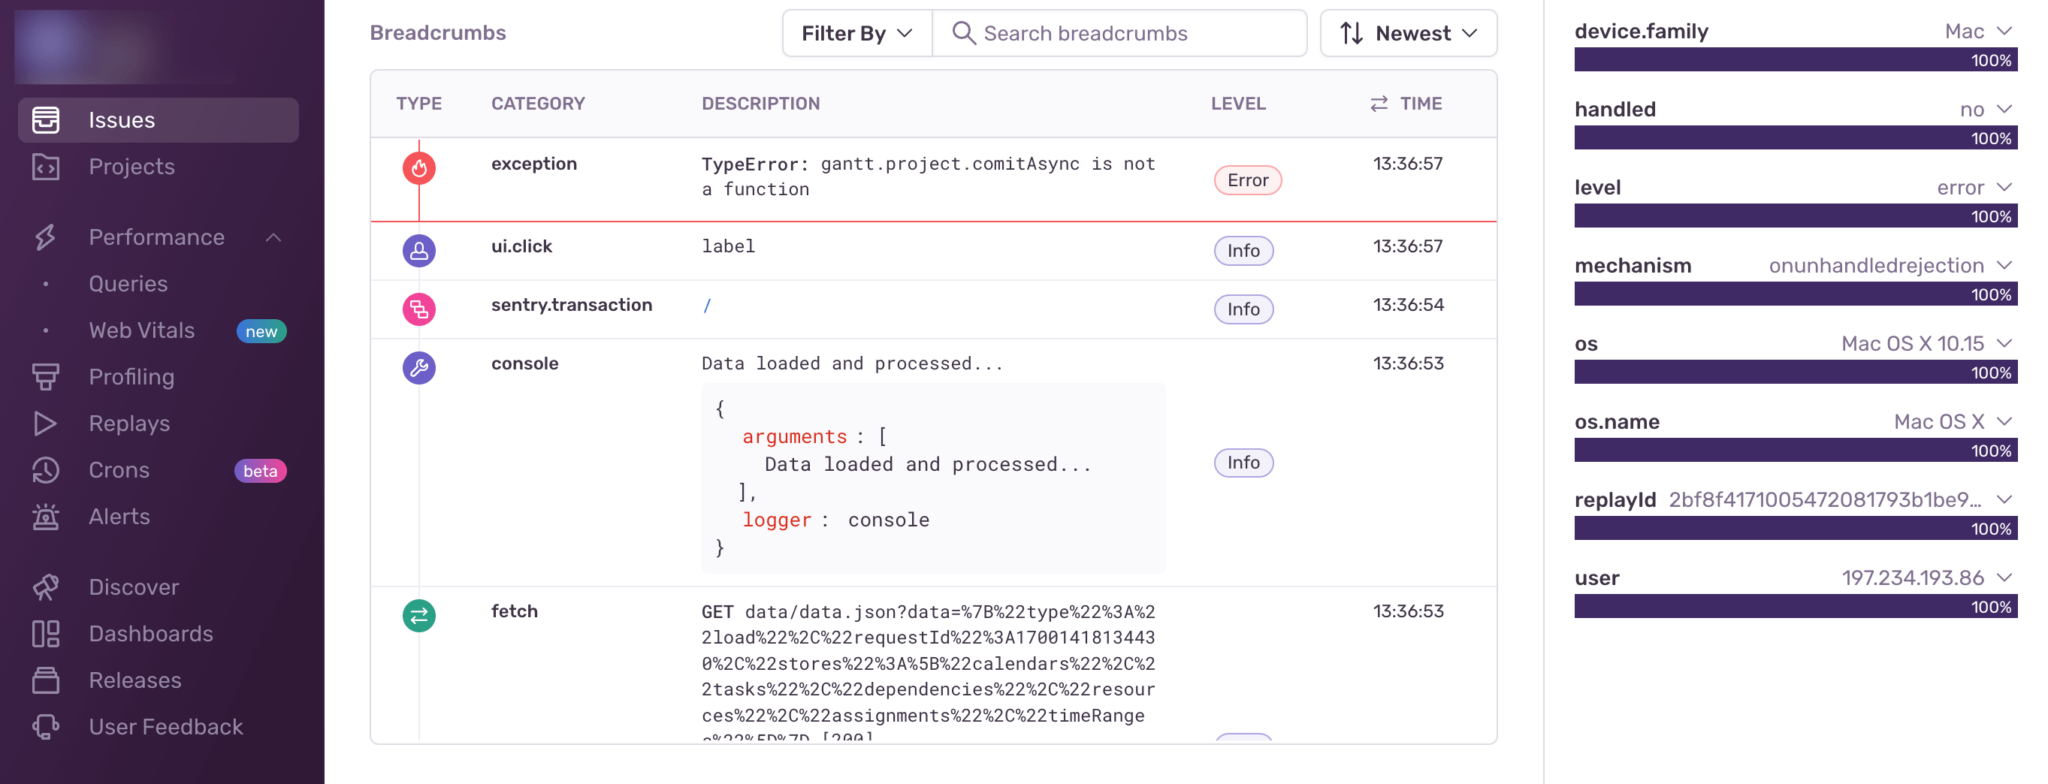
The dashboard has many other features, such as assigning errors and performance metrics.
Adding source maps for a more readable stack trace
In the stack trace, you’ll see that it doesn’t show us exactly where the error occurred in our code, as the source code is not shown. To show the source code, Sentry needs to configure the source maps. The easiest way to do this is to run the Sentry Source Map Wizard. Run the following command in your terminal in your Bryntum Gantt app:
npx @sentry/wizard@latest -i sourcemapsSelect Vite as the bundler tool. To check that source maps have been configured, we’ll first create a production build of our Bryntum Gantt by running the following command:
npm run buildNow serve your newly created production build in the /dist folder by running the following command:
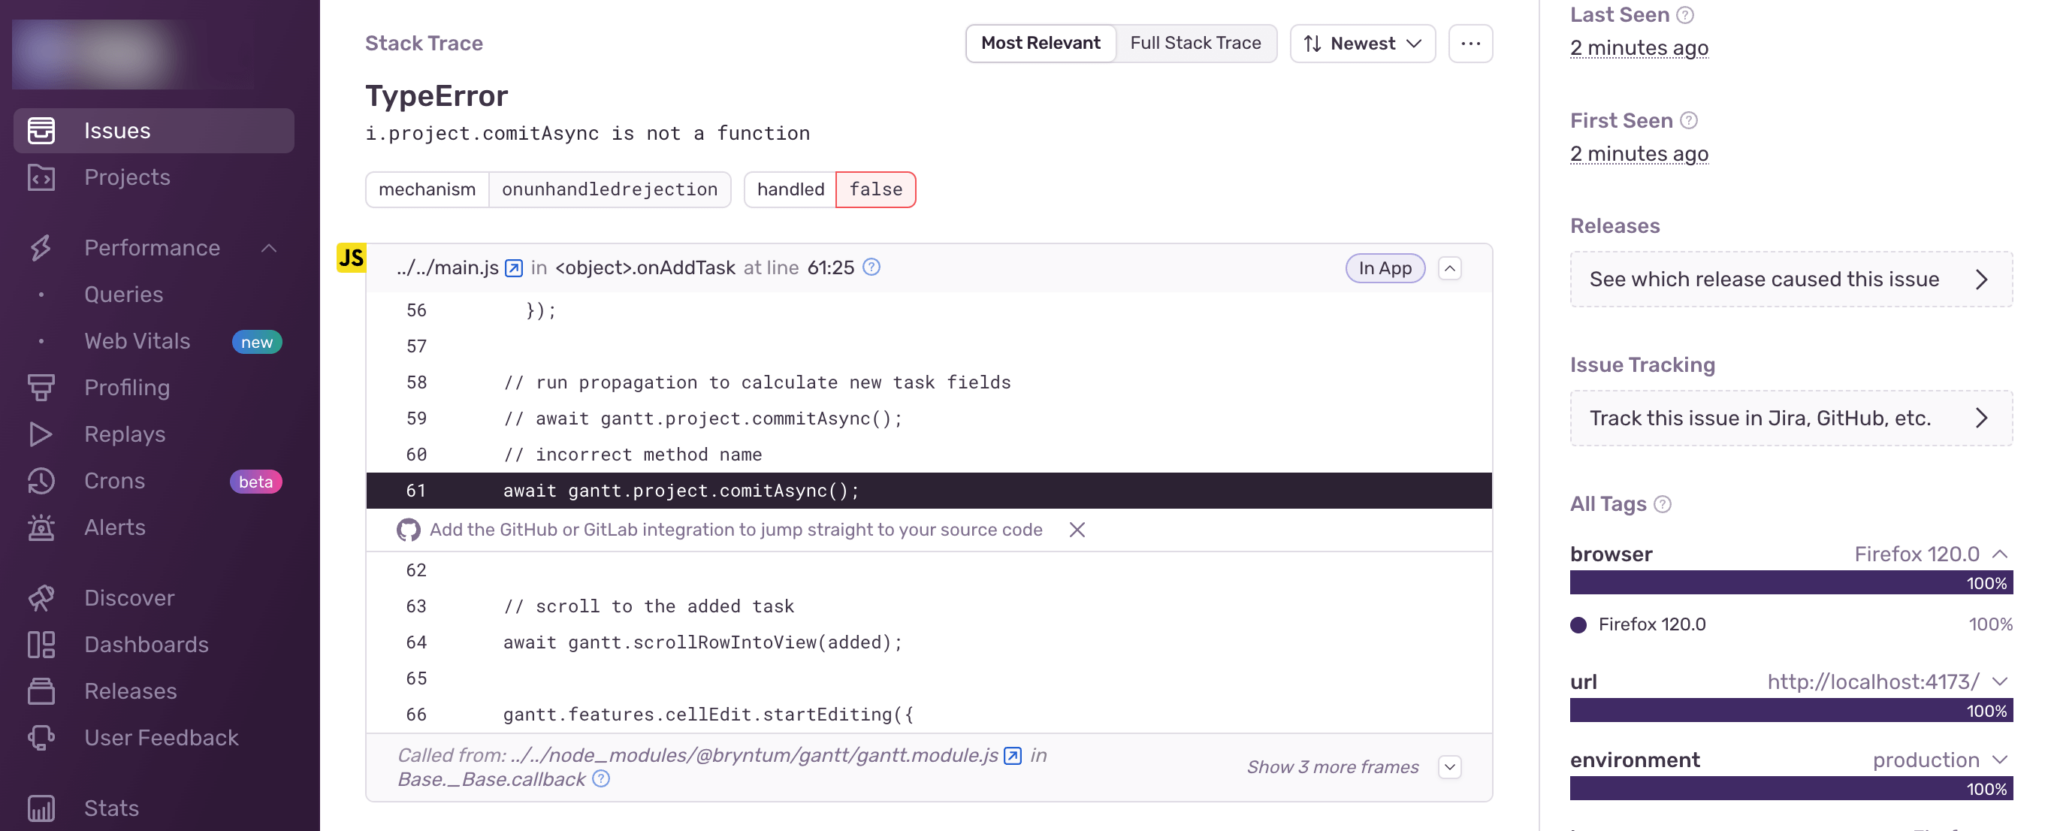
npm run previewClick the “+ CREATE” button to cause the unhandled error to occur again, and then go back to your Sentry dashboard issues page. Look at the stack trace of the new error; it should show where the error occurred in your main.js file:
Logging a handled error
If you drag a percent complete bar to 100%, it will cause an error in the onPercentBarDrag method. This error won’t be detected by Sentry as it’s a handled error. To log this error, add the following line in the catch method in the onPercentBarDrag method:
Sentry.captureException(error);To capture an error manually, we pass in an error object as an argument. If you want to capture a custom text message, you can use the captureMessage method:
Sentry.captureMessage("Something went wrong");Drag a percent complete bar to 100% in your Bryntum Gantt. You’ll see a new error in your Sentry dashboard issues page. If you view the Session Replay, you’ll see the cause of the error.
Let’s capture one more type of error: Errors that occur when there’s a data loading error. In the project.load() call, add the following line in the catch() method that catches loading errors:
Sentry.captureException(error);Run npm run build and npm run preview again. In the /dist/data/data.json file, remove a comma from the “success” key to make the JSON data invalid. Reload the Bryntum Gantt app page. You’ll see a Bryntum Gantt error message: “Data loading failed!”. In the Sentry dashboard issues page, you’ll see a new “Load failed” error.
Now, let’s see how we can log these errors using LogRocket.
Adding LogRocket to the Bryntum Gantt chart
We’ll start by creating a new branch. We’ll checkout the Bryntum Gantt chart app’s completed-gantt branch, which is the code for the completed Gantt chart without the Sentry code.
First, fetch all remote branches:
git fetch originNow checkout the completed-gantt branch and make a copy of it:
git checkout -b completed-gantt origin/completed-ganttLogRocket has one free basic plan and three paid plans that have more functionality, such as JavaScript error reporting, detailed product analysis, and machine-learning-powered issue reporting. The paid plans have a 14-day free trial. Learn more about the different plans on the LogRocket pricing page.
Creating a LogRocket account
Sign up for a LogRocket account by visiting their sign-up page. Once you’ve signed up, follow the onboarding steps to get a script tag that we’ll use to add LogRocket to our Bryntum Gantt chart app. When you sign up, you’ll get a 14-day free trial of the Professional plan.
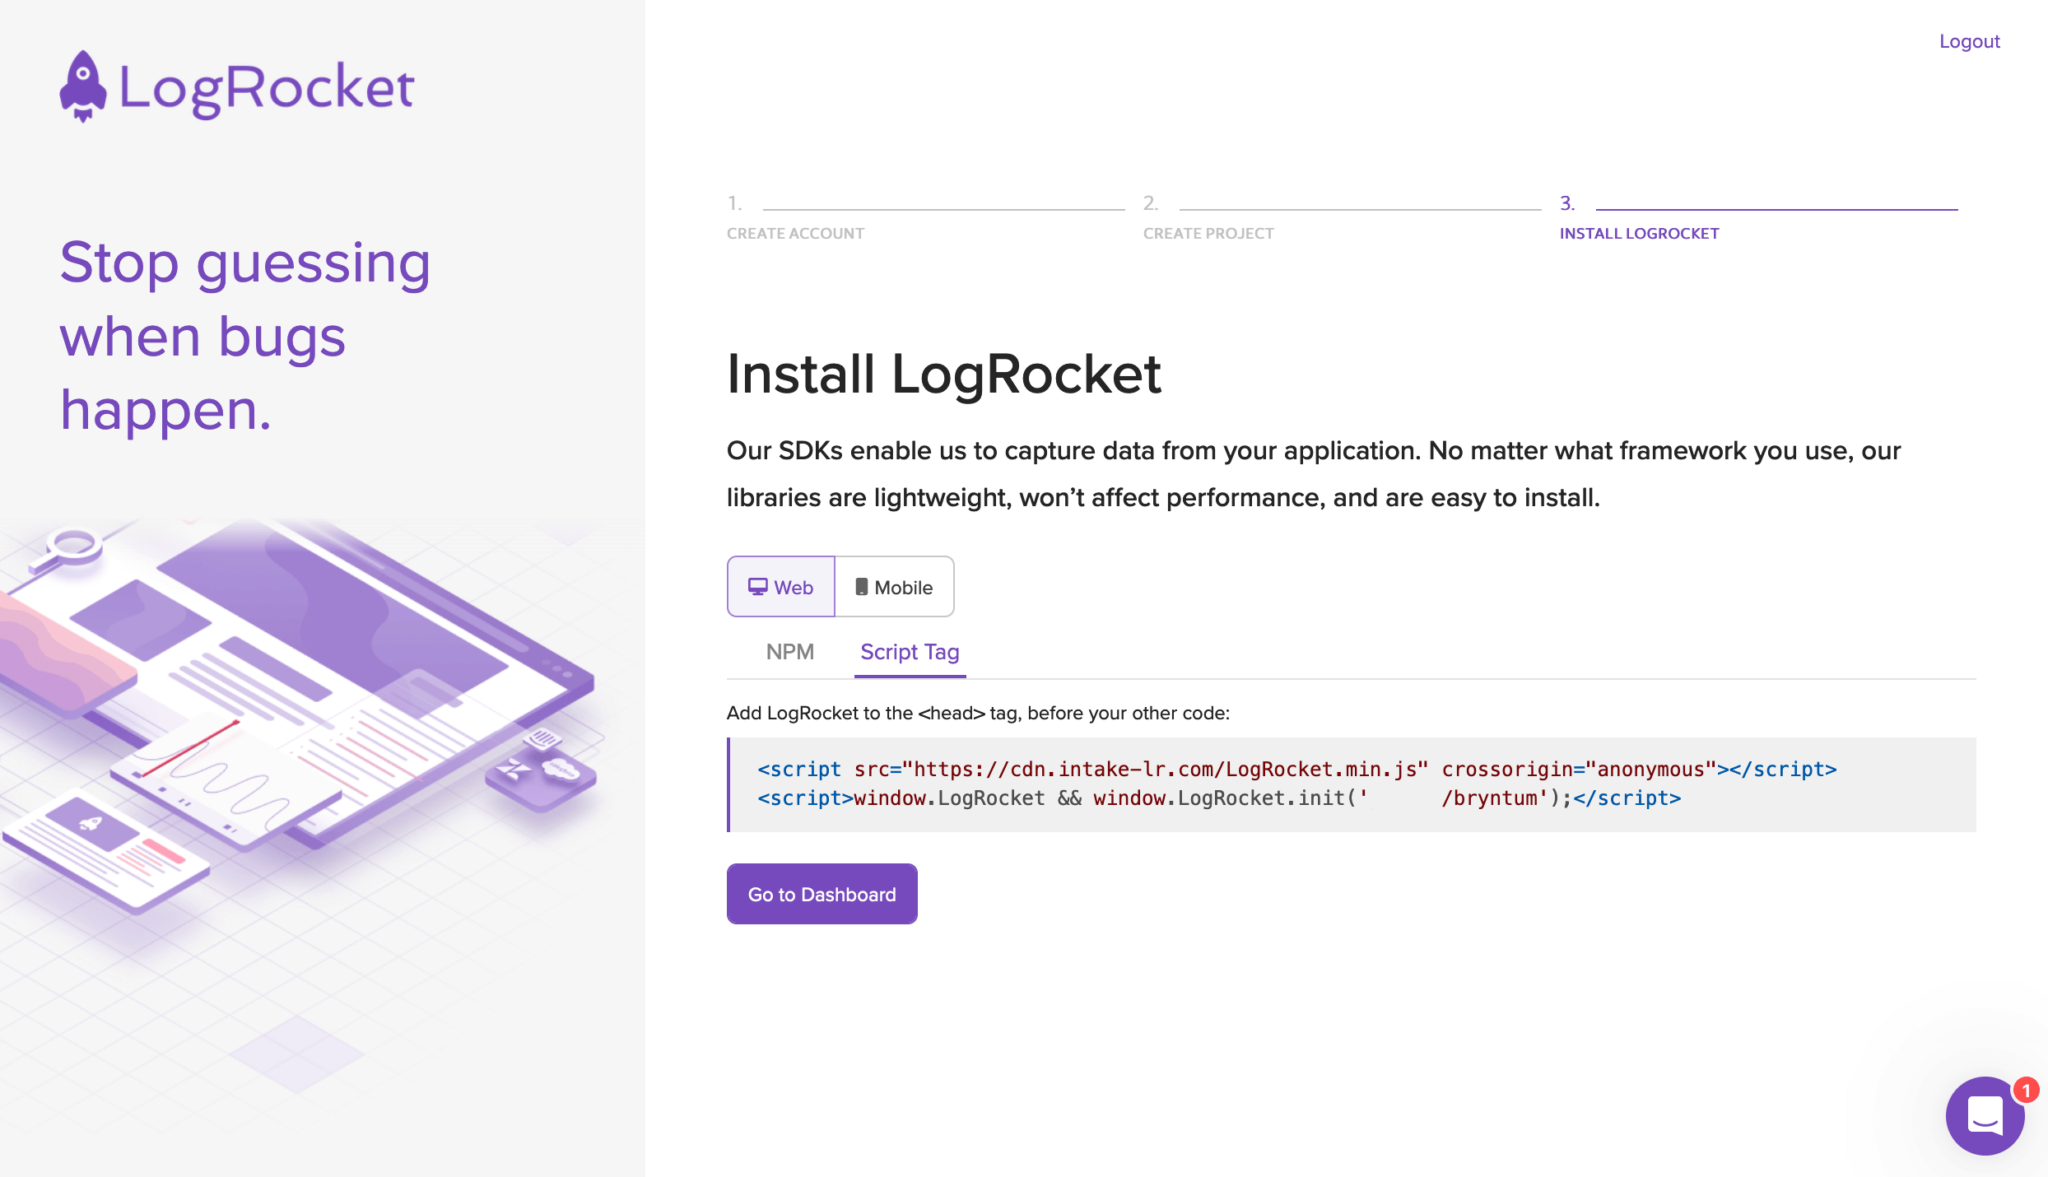
Now add the provided script tags inside the <head> tag in your index.html file. It should look like the following script tags:
<script src="https://cdn.lr-intake.com/LogRocket.min.js" crossorigin="anonymous"></script>
<script>window.LogRocket && window.LogRocket.init('<randomstring>/bryntum-gantt');</script>
The random string is your app ID. We call init() with your app ID to configure and start LogRocket. Click the “Go to Dashboard” button in the last step of the LogRocket onboarding.
Logging an unhandled error
Now add the following line of code to the bottom of your main.js file to cause an unhandled error:
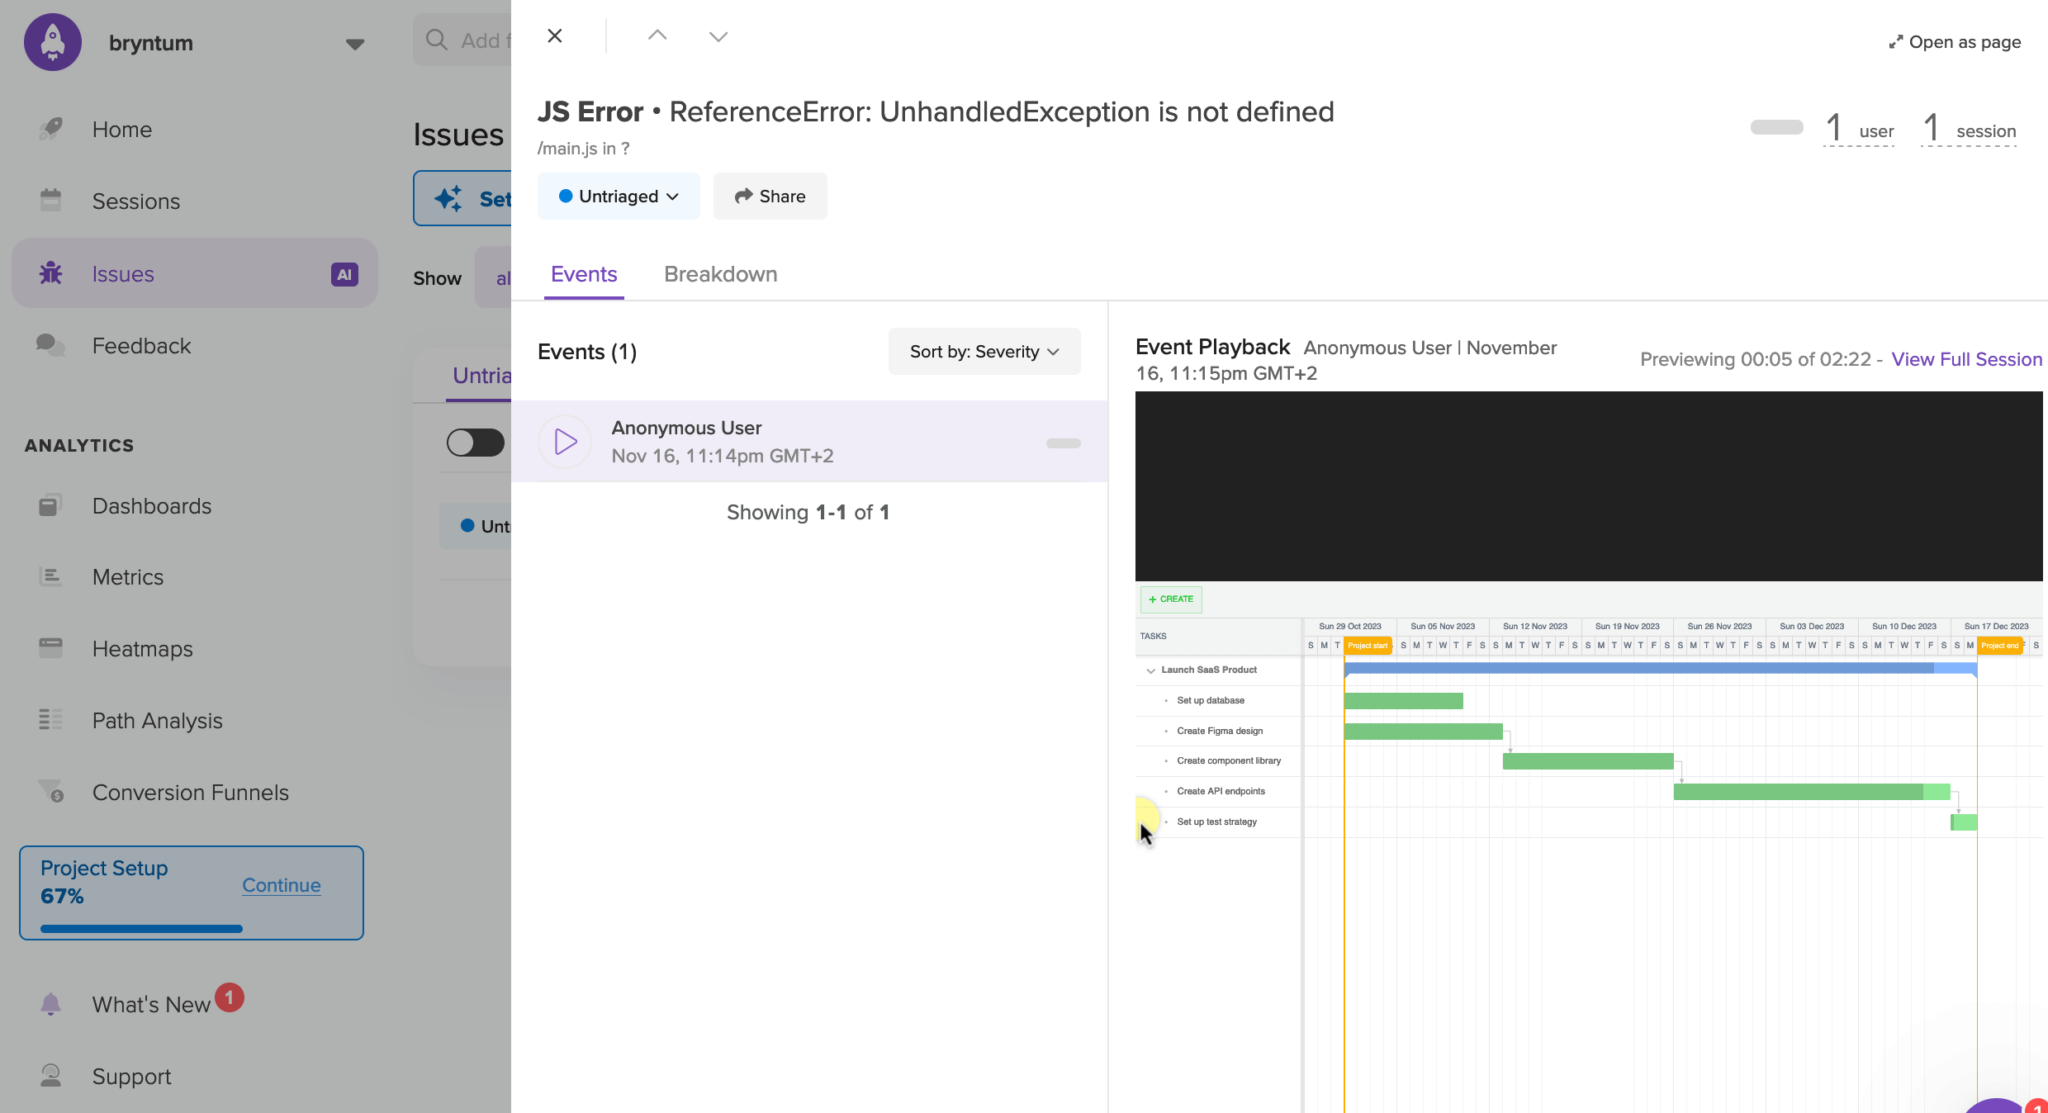
UnhandledException();Run your development server so that the error occurs, then go to your LogRocket dashboard. In the Issues page, you’ll see the error: “JS Error • ReferenceError: UnhandledException is not defined”. If you click on the issue, you’ll see information about the error, such as the browser and operating system where the error occurred, a stack trace, and a session replay.
On the Issues page, you’ll see that LogRocket categorizes errors as High, Low, Ignored, or Untriaged. You can manually change the category of an issue by clicking on the issue dropdown menu in the issue name column. There is also an option to show only recommended issues. LogRocket uses machine learning to determine which issues are severe based on data from LogRocket sessions and issues. Issues are assigned a severity score, where higher severity scores may indicate user frustration and users being unable to complete a task. The more data you have, the more accurate the severity scores will be.
You can use the identify method to identify users. Sentry has a setUser method to do the same.
Now, let’s log an unhandled error in our Gantt chart. Remove the non-existent function call:
UnhandledException();In the onAddTask method, replace the following lines:
    try {
      await gantt.project.comitAsync();
    } catch (error) {
      console.error(error);
    }
With these lines of code:
    try {
      await gantt.project.comitAsync();
    } catch (error) {
      LogRocket.captureException(error);
    }
We need to capture this unhandled error manually. Sentry was able to capture this unhandled error automatically.
Run the development server and click the “+ CREATE” button. You should see a new error in the Issues page: “JS Error • TypeError: gantt.project.comitAsync is not a function”. Click on the error list item and in the “Event Playback” section on the right, click the “View Full Session” link. You’ll be able to see a session replay of how the unhandled error occurred:
The event timeline in the session replay is similar to the Sentry error logging breadcrumbs of the events that led up to an error. You can click on the events to see more details about the event. The session replay features are pretty similar to Sentry’s Session Replay features. LogRocket’s session replay also has a visual heat map that shows the frequency of user interactions on a page. A heat map can help you identify UX issues and improve sales by identifying actions that lead to sales or loss of sales.
If you watch the session replay, you’ll see that the task names text is not hidden like it was with the Sentry Session Replay. You can hide the text by sanitizing all DOM text fields in the LogRocket init function call.
Adding source maps for a more readable stack trace
Go back to the Issues page and open the error again. Scroll to the bottom to see the stack trace.
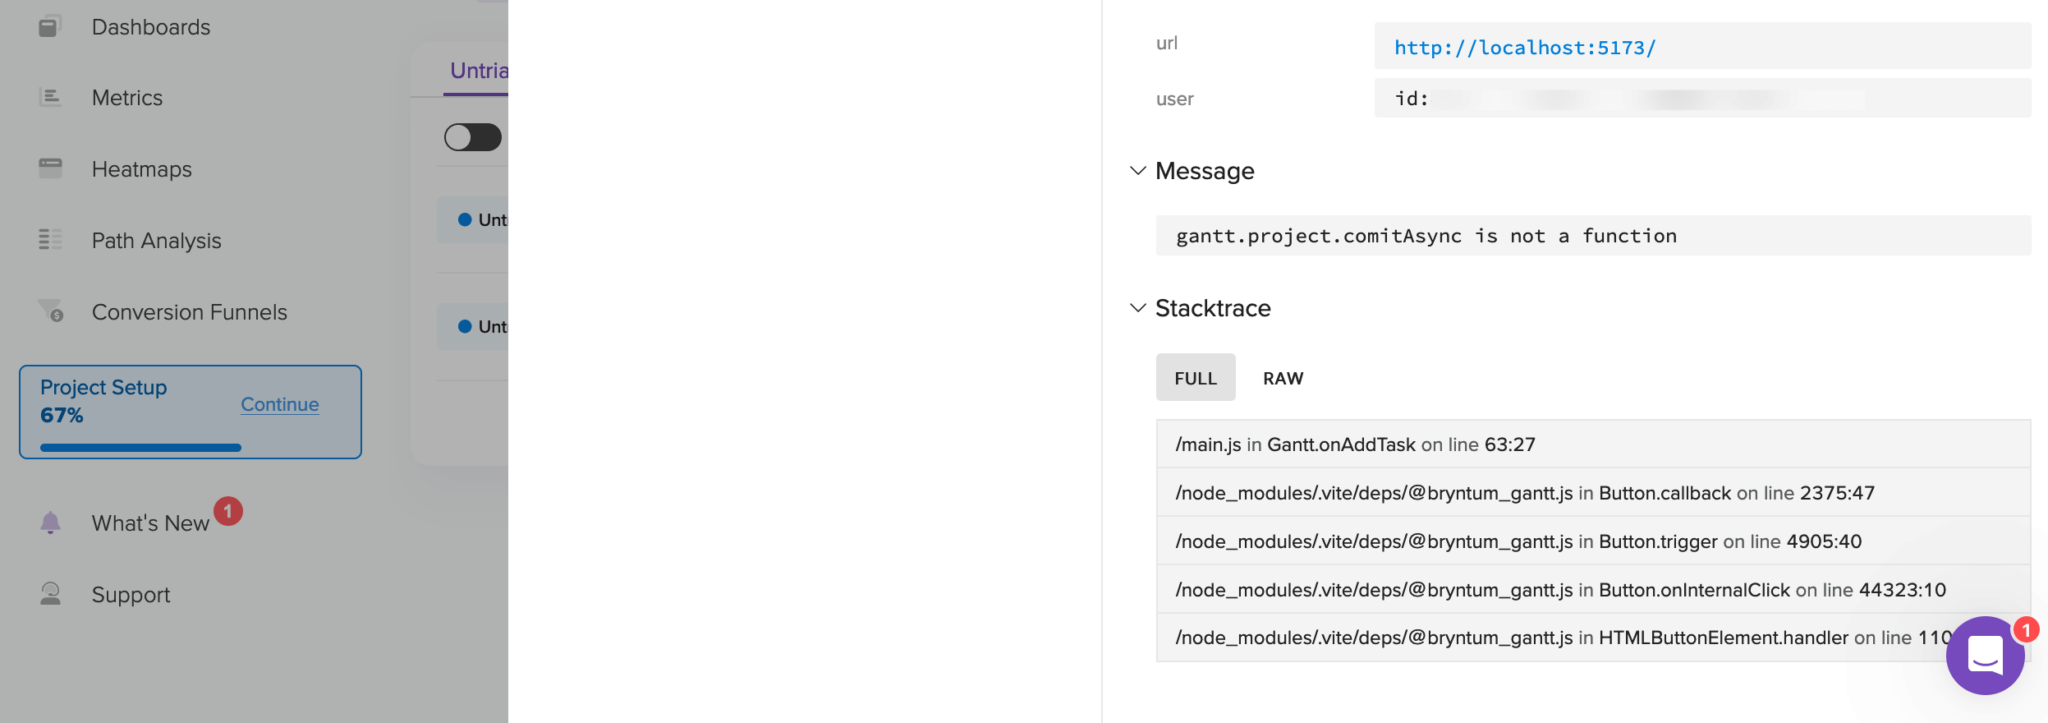
The stack trace shows which line the error occurred on in the original code but it does not show the original code. We can add source maps to LogRocket to show more details.
First, install the LogRocket command line tool:
npm install -g logrocket-cliNext, we’ll create a release. All source maps that you upload must be associated with a release. To create a release, add a release property to the second argument of the init function in the script tag in the <head> of the index.html file.
<script>window.LogRocket && window.LogRocket.init('yourorg/yourapp', { release: 'test' });</script>We’ll use the command line to create the release. You’ll need an API key, which you can find on the “General Settings” page. Go to the “Settings” > “Project Settings” navigation menu item at the bottom of the sidebar menu on the left side of your LogRocket dashboard.
Now run the following command to create a release, replacing your:api:key with your API key:
logrocket release test --apikey="your:api:key"We need to create the source maps for the release. Create a vite.config.js file in the root folder of your app and add the following lines of code:
export default {
  // config options
  build: {
    sourcemap: true,
  },
};
Run npm run build, and the output /dist folder will have source maps created in the /dist/assets folder. Upload the source maps and compressed JavaScript files for the release by running the following command:
logrocket upload ./dist --release=test --apikey="your:api:key"Preview your build locally by running the following command:
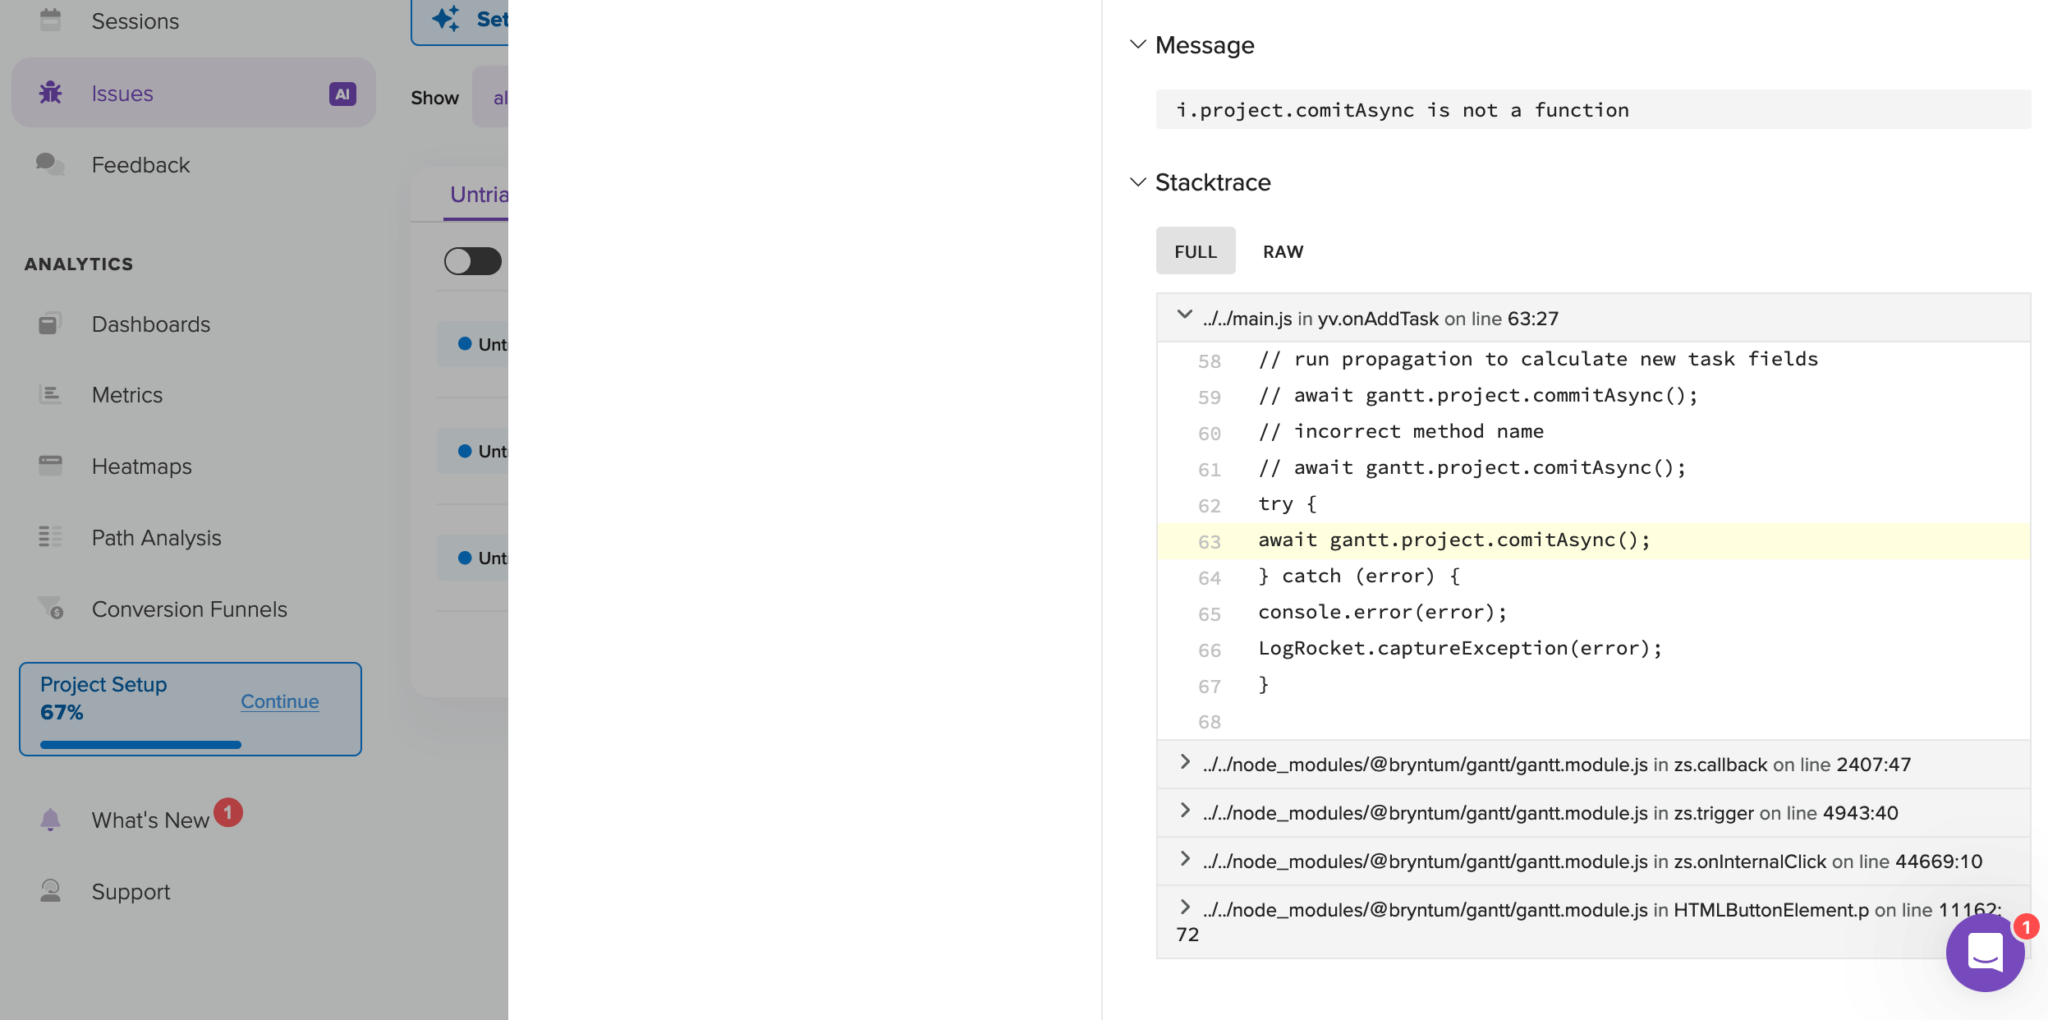
npm run previewCreate a new error by clicking the “+ CREATE” button. Go to the Issues page and open the error. Scroll to the bottom to see the stack trace. You’ll see the source code in the stack trace:
You can also detect rage clicks and dead clicks. Rage clicks are rapid clicks on the same element multiple times. Dead clicks are clicks on an unresponsive interactive UI element, such as a button. Sentry recently added these functionalities, but LogRocket detected rage clicks and dead clicks in the Bryntum Gantt better than Sentry.
Logging a handled error
If you drag a percent complete bar to 100%, it will cause an error in the onPercentBarDrag method. LogRocket won’t detect this error as it’s a handled error. To log this error, add the following line in the catch method in the onPercentBarDrag method:
LogRocket.captureException(error);To capture an error manually, we pass in an error object as an argument to the captureException method. If you want to capture a custom text message, you can use the captureMessage method:
LogRocket.captureMessage("Something went wrong");In your LogRocket dashboard Issues page, you’ll see a new error.
Let’s capture an error that occurs when there’s a data loading error. In the project.load() call, add the following line in the catch() method that catches loading errors:
LogRocket.captureException(error);Run npm run build and npm run preview again. In the /dist/data/data.json In the file, remove a comma from the “success” key to make the JSON data invalid. When you load the page, you’ll see a Bryntum Gantt error message, “Data loading failed!” In the LogRocket dashboard issues page, you’ll see a new “Load failed” error.
Comparing Sentry and LogRocket
Sentry automatically captures unhandled errors in your application and sends them to your project in the Sentry platform. You can use Sentry for frontend and backend error logging. Similar errors are grouped into issues, and you can view stack traces of errors, breadcrumbs that show what events lead to an error, and Session Replays to see what the user did in the UI that led to the error. You can manually capture handled errors or set up alerts for specific events, and Sentry also allows you to monitor site performance, check for usability issues, check test coverage, and assign issues to a developer. Sentry’s source code is open source, and the platform offers a free self-hosted version that’s suitable for small-scale deployments and proof-of-concept projects.
LogRocket is a frontend error- and performance-monitoring platform. The main LogRocket feature is its session replays, but it also has error tracking that groups errors into issues and supports source maps so that you can view stack traces to locate errors in your code. LogRocket product analytics allows you to analyze how users interact with your website, giving you insight into what actions led to important events such as sales and loss of sales. You can also detect usability issues, analyze UX interactions, and monitor site performance with LogRocket.
There is considerable overlap in the features and functionality of Sentry and LogRocket: Both platforms capture unhandled errors in your application and have similar methods to manually capture errors or to log messages.
The following table shows which error logger was the best for some features:
| Feature | Sentry | LogRocket |
| Capturing unhandled errors | ✔️ | |
| Session replay | ✔️ | |
| Rage clicks and dead clicks detection | ✔️ | |
| Real-time error tracking | ✔️ | |
| Detailed stack traces | ✔️ | |
| User experience analytics | ✔️ |
In our comparison exercise, Sentry was better at capturing unhandled errors. LogRocket did not automatically capture the unhandled error in the onAddTask method in the Bryntum Gantt. We found the LogRocket session replay more feature-rich than the Sentry Session Replay, with extra features like user interaction heat maps and viewing a session across multiple tabs. LogRocket was also better at detecting rage clicks and dead interactive element clicks.
Sentry had better real-time error tracking. Sometimes errors would take a few minutes to appear in the LogRocket Issue page. Creating and setting up source maps was easier with Sentry than with LogRocket, thanks to the Sentry Source Map Wizard.
There are privacy concerns when logging user data and tracking their activity. Both Sentry and LogRocket take user privacy seriously and allow you to control what data to exclude from error logs.
While both Sentry and LogRocket allow you to set up alerts for issues, with Sentry, you can also assign issues to team members.
Conclusion
Overall, Sentry and LogRocket performed similarly in capturing and logging the simple errors in our Bryntum Gantt app. The choice between the two depends on your specific project requirements. LogRocket is more suited to projects where you want to understand errors visually and understand user behaviour trends using features such as session replays and user interaction heat maps. Sentry is better for more detailed error tracking. LogRocket is frontend-focused, whereas Sentry can also log backend errors and supports many different programming languages.
You can also integrate LogRocket with Sentry by adding a LogRocket session recording URL to every Sentry exception report.
If you’re new to Bryntum components, we provide a 45-day free trial to explore the powerful capabilities of Bryntum products in your projects. Our forums are always open if you have any questions or need support.