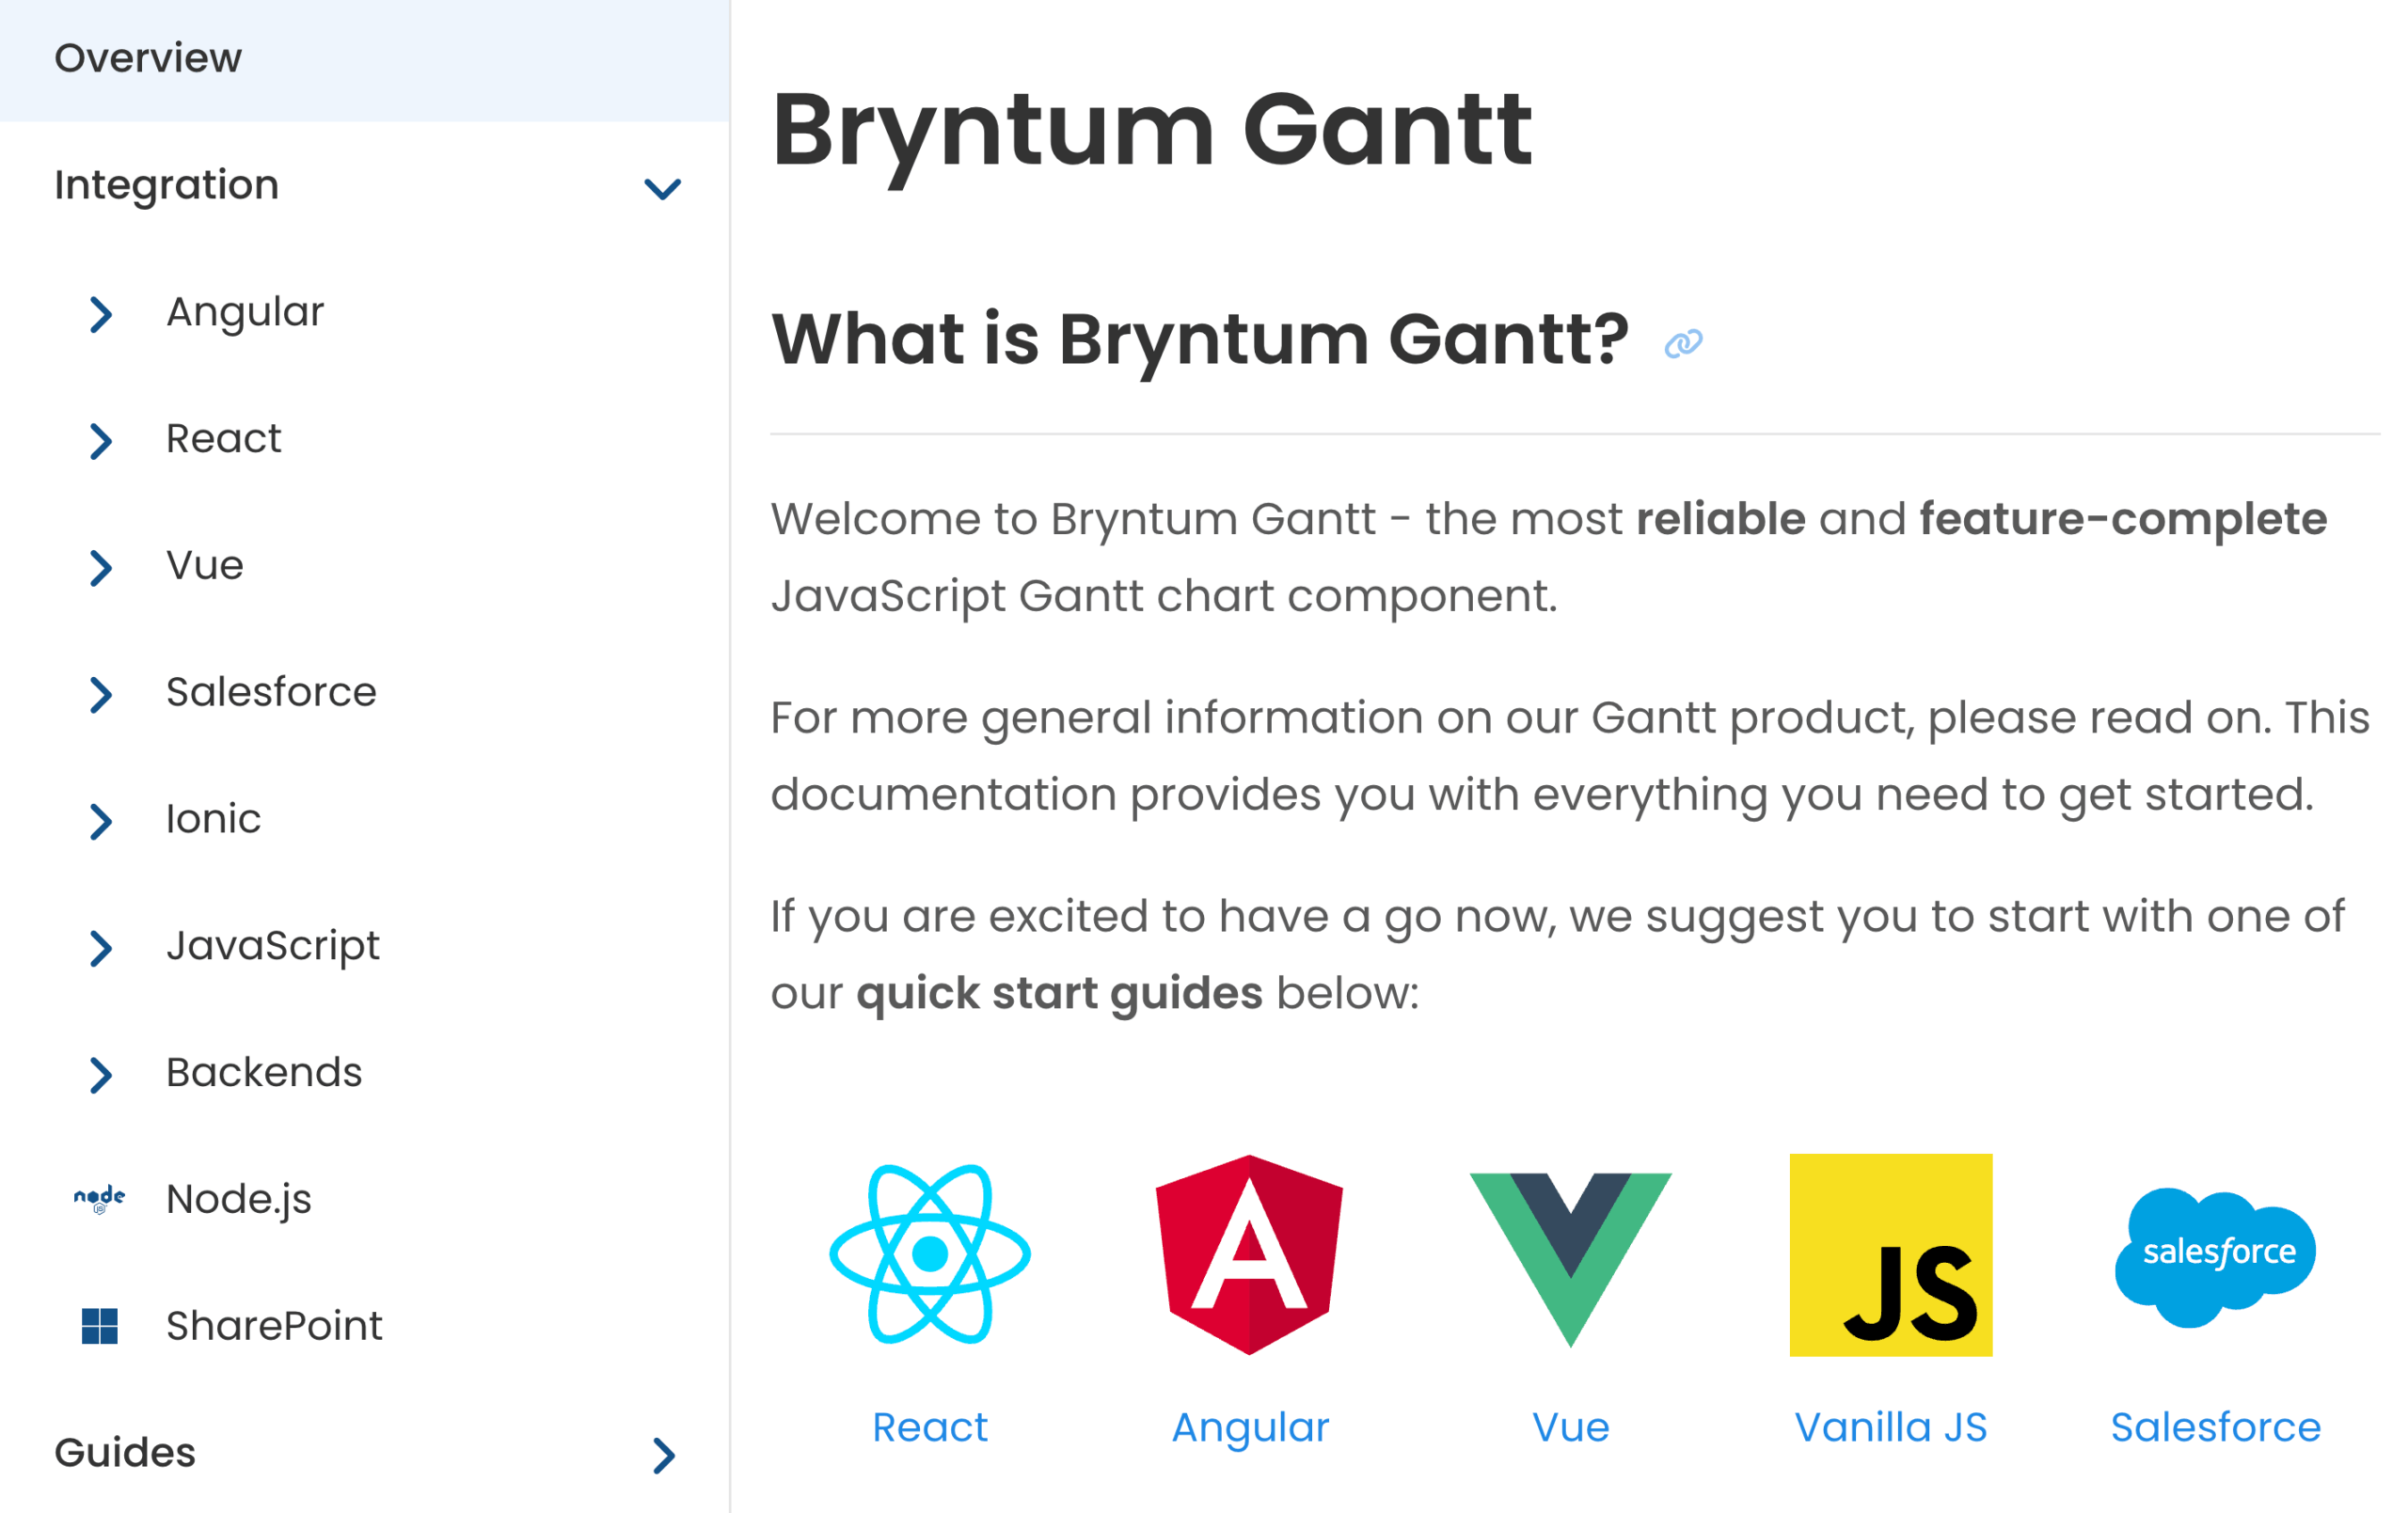
Easy Integration With Your Stack
Tools for Real-World Projects
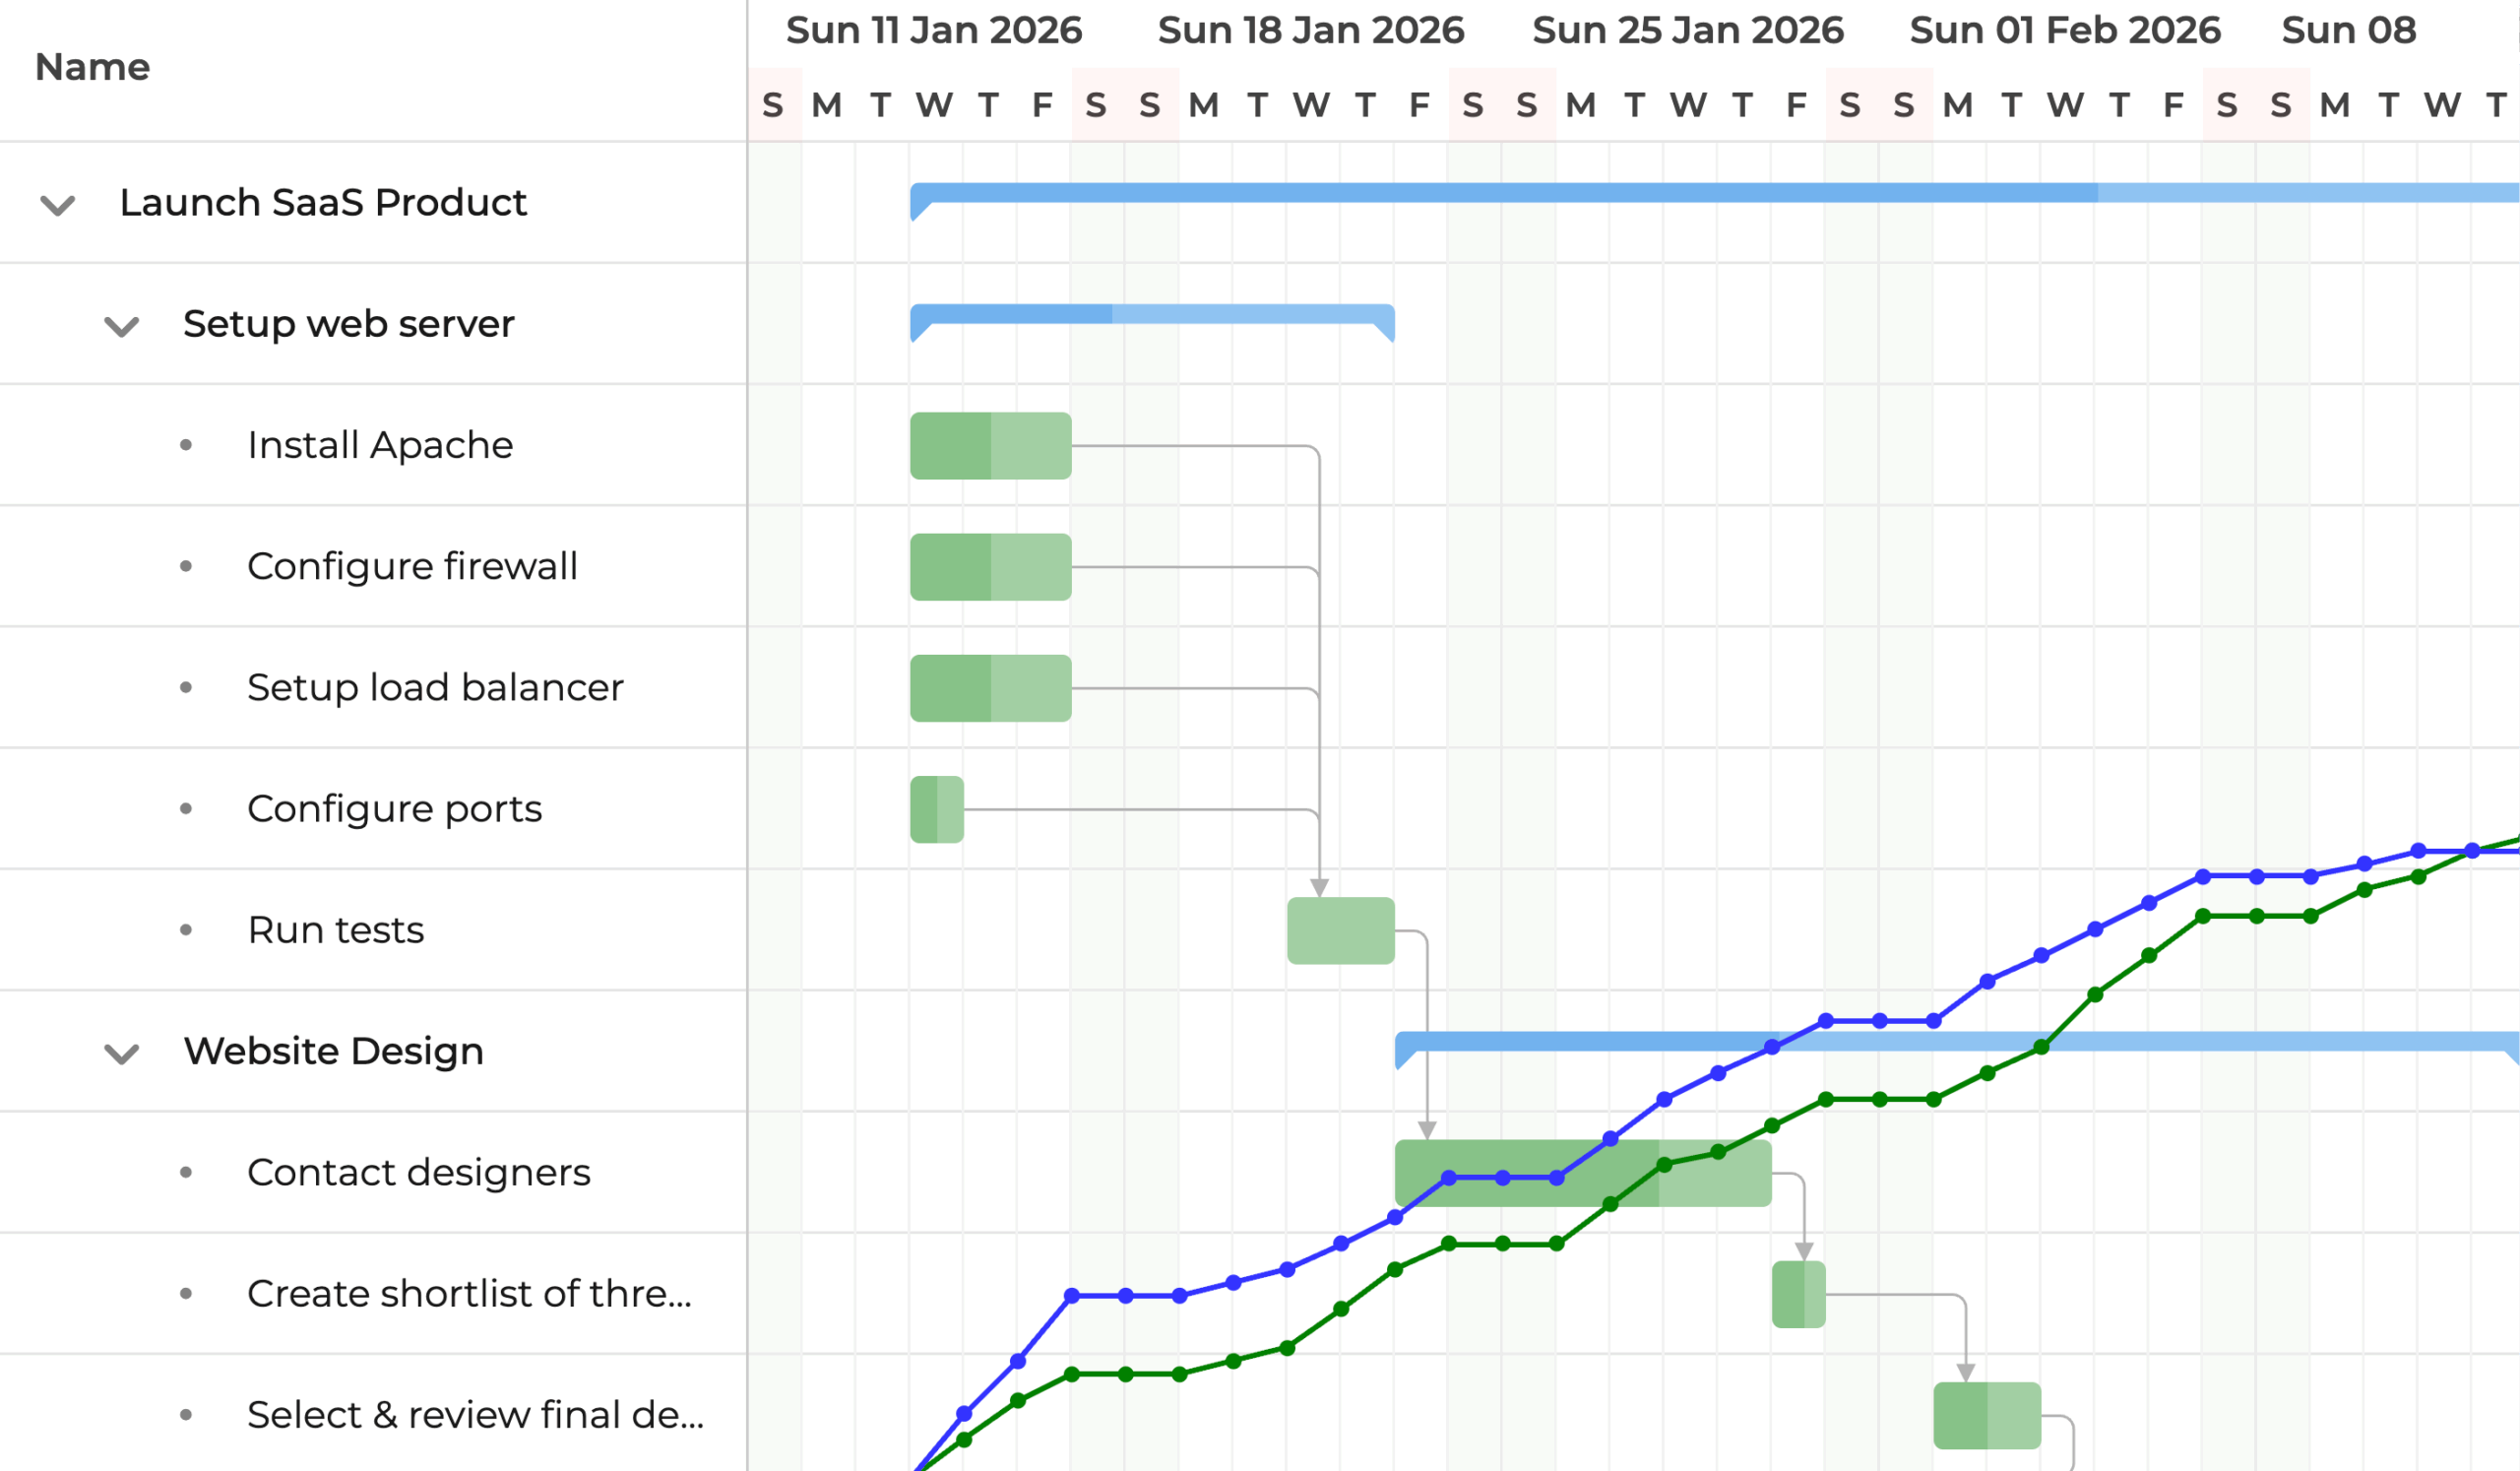
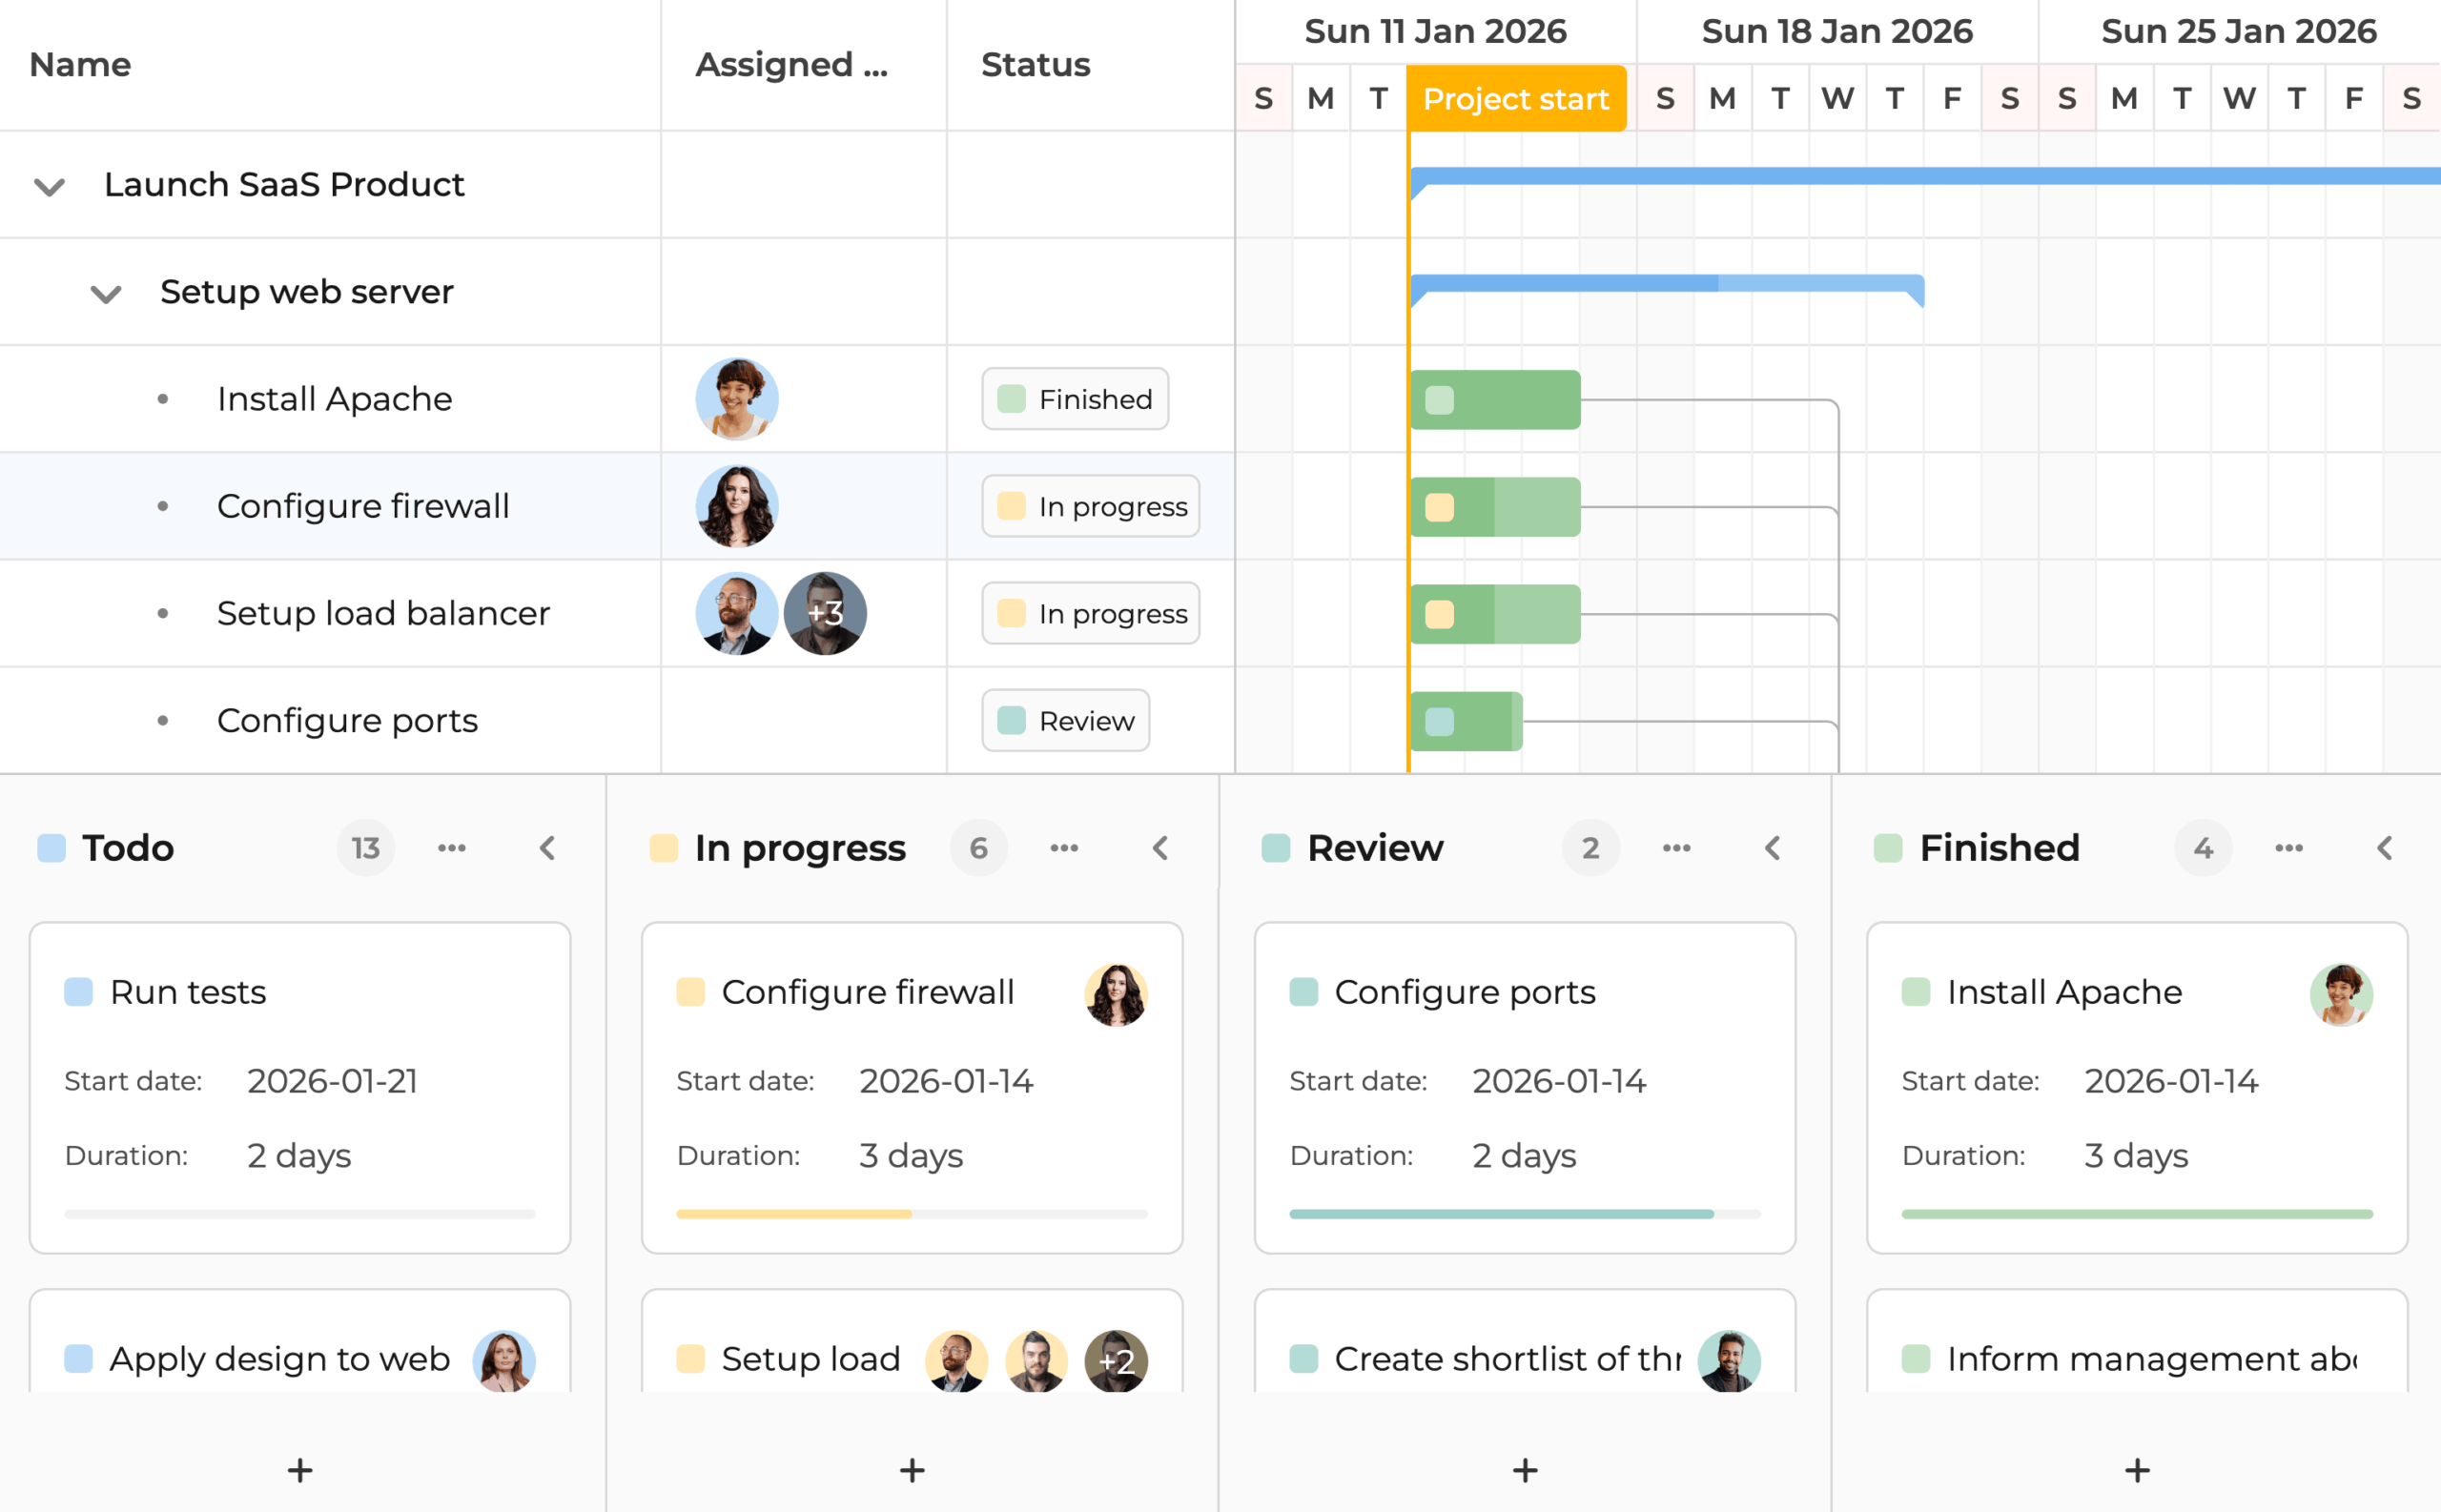
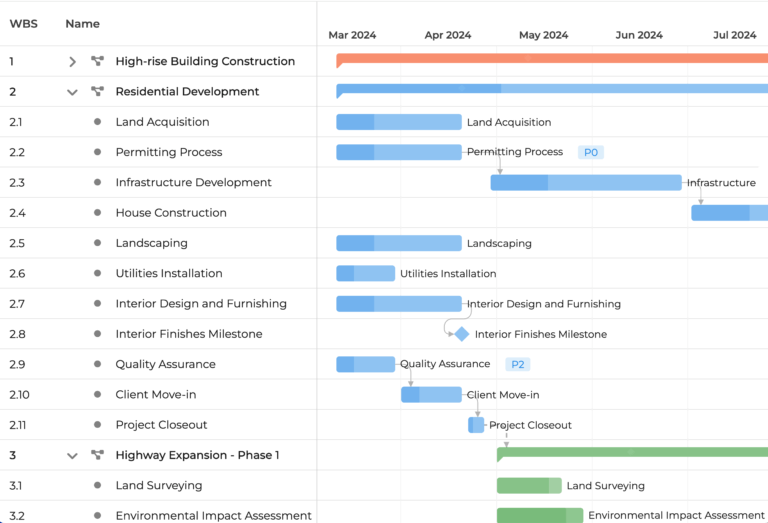
Bryntum Gantt is engineered to help you handle real-world complexity and simplify project planning through smart and intuitive tools:
- See the rate of progress with an S-curve.
- Compare task durations across baselines and visualize completed percentages.
- Identify critical paths to fast-track project completion.
- Resolve or postpone scheduling conflicts to maintain the integrity of your plan.
Lightning Fast
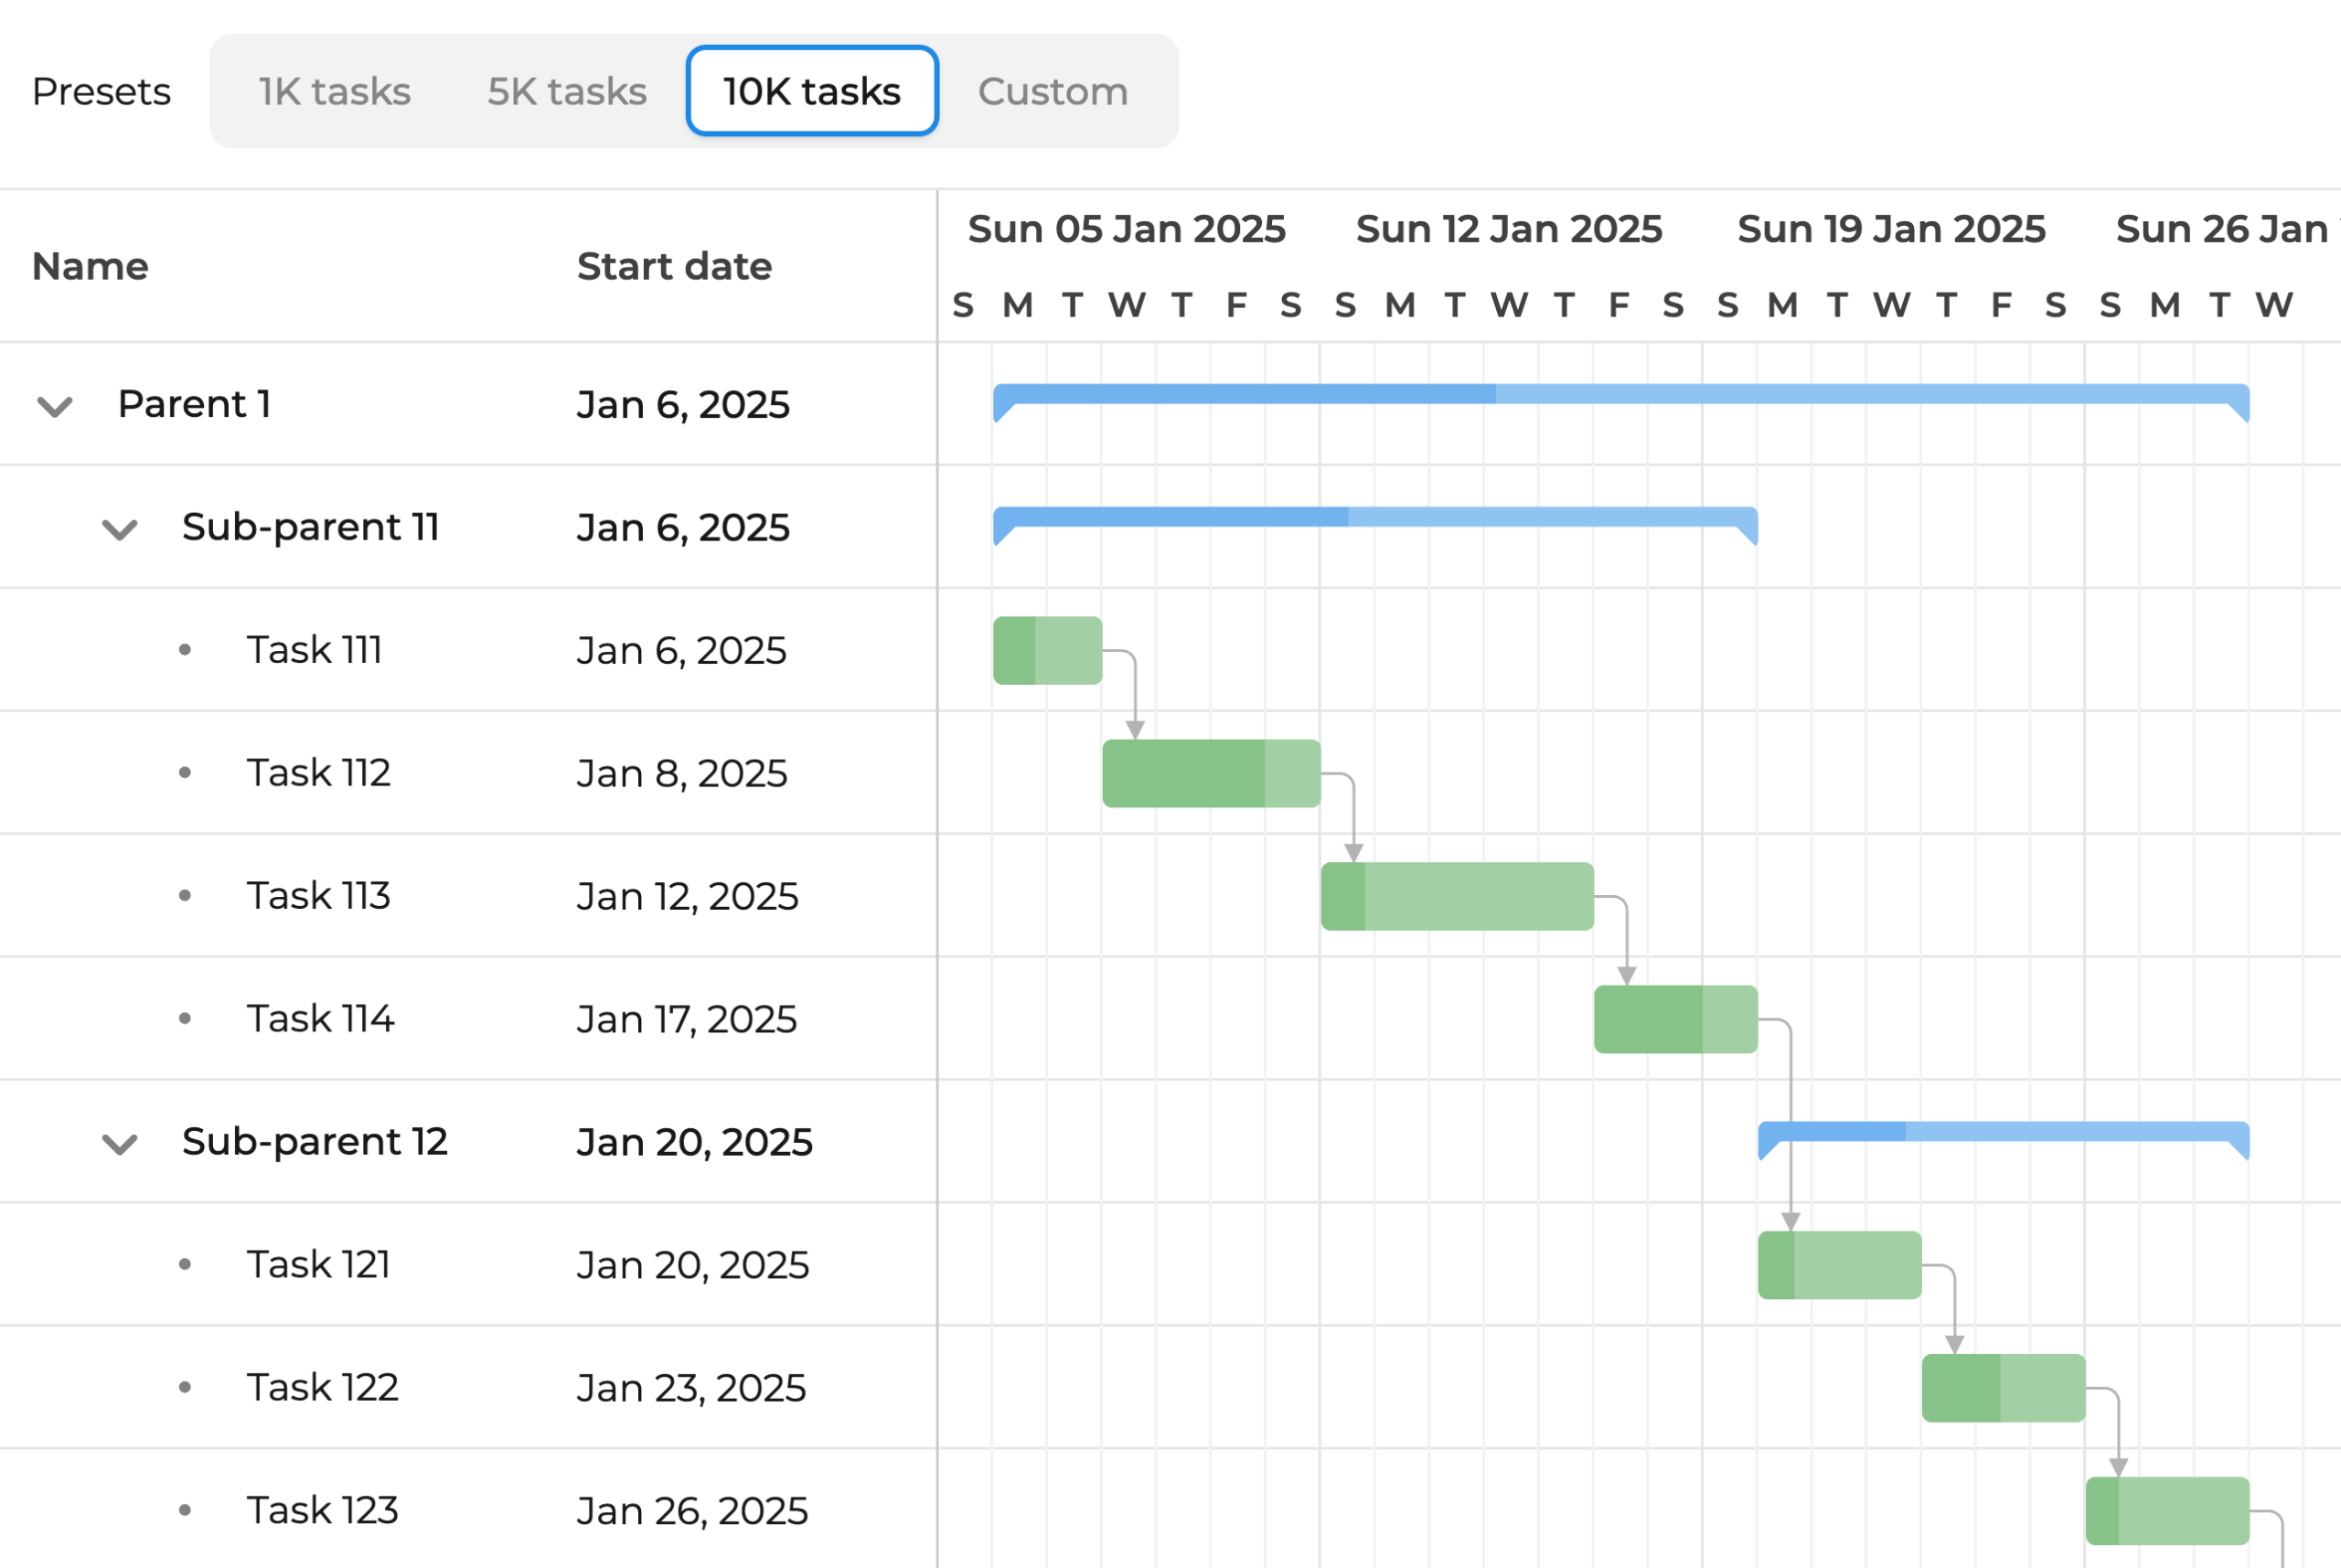
Built with modern JavaScript (ES6+) for fast and efficient execution, Bryntum Gantt is a JavaScript component optimized for speed so teams can stay focused on planning:
- Easily handle large datasets and advanced features.
- Keep interactions smooth and responsive using instant updates.
Fully Flexible Customization
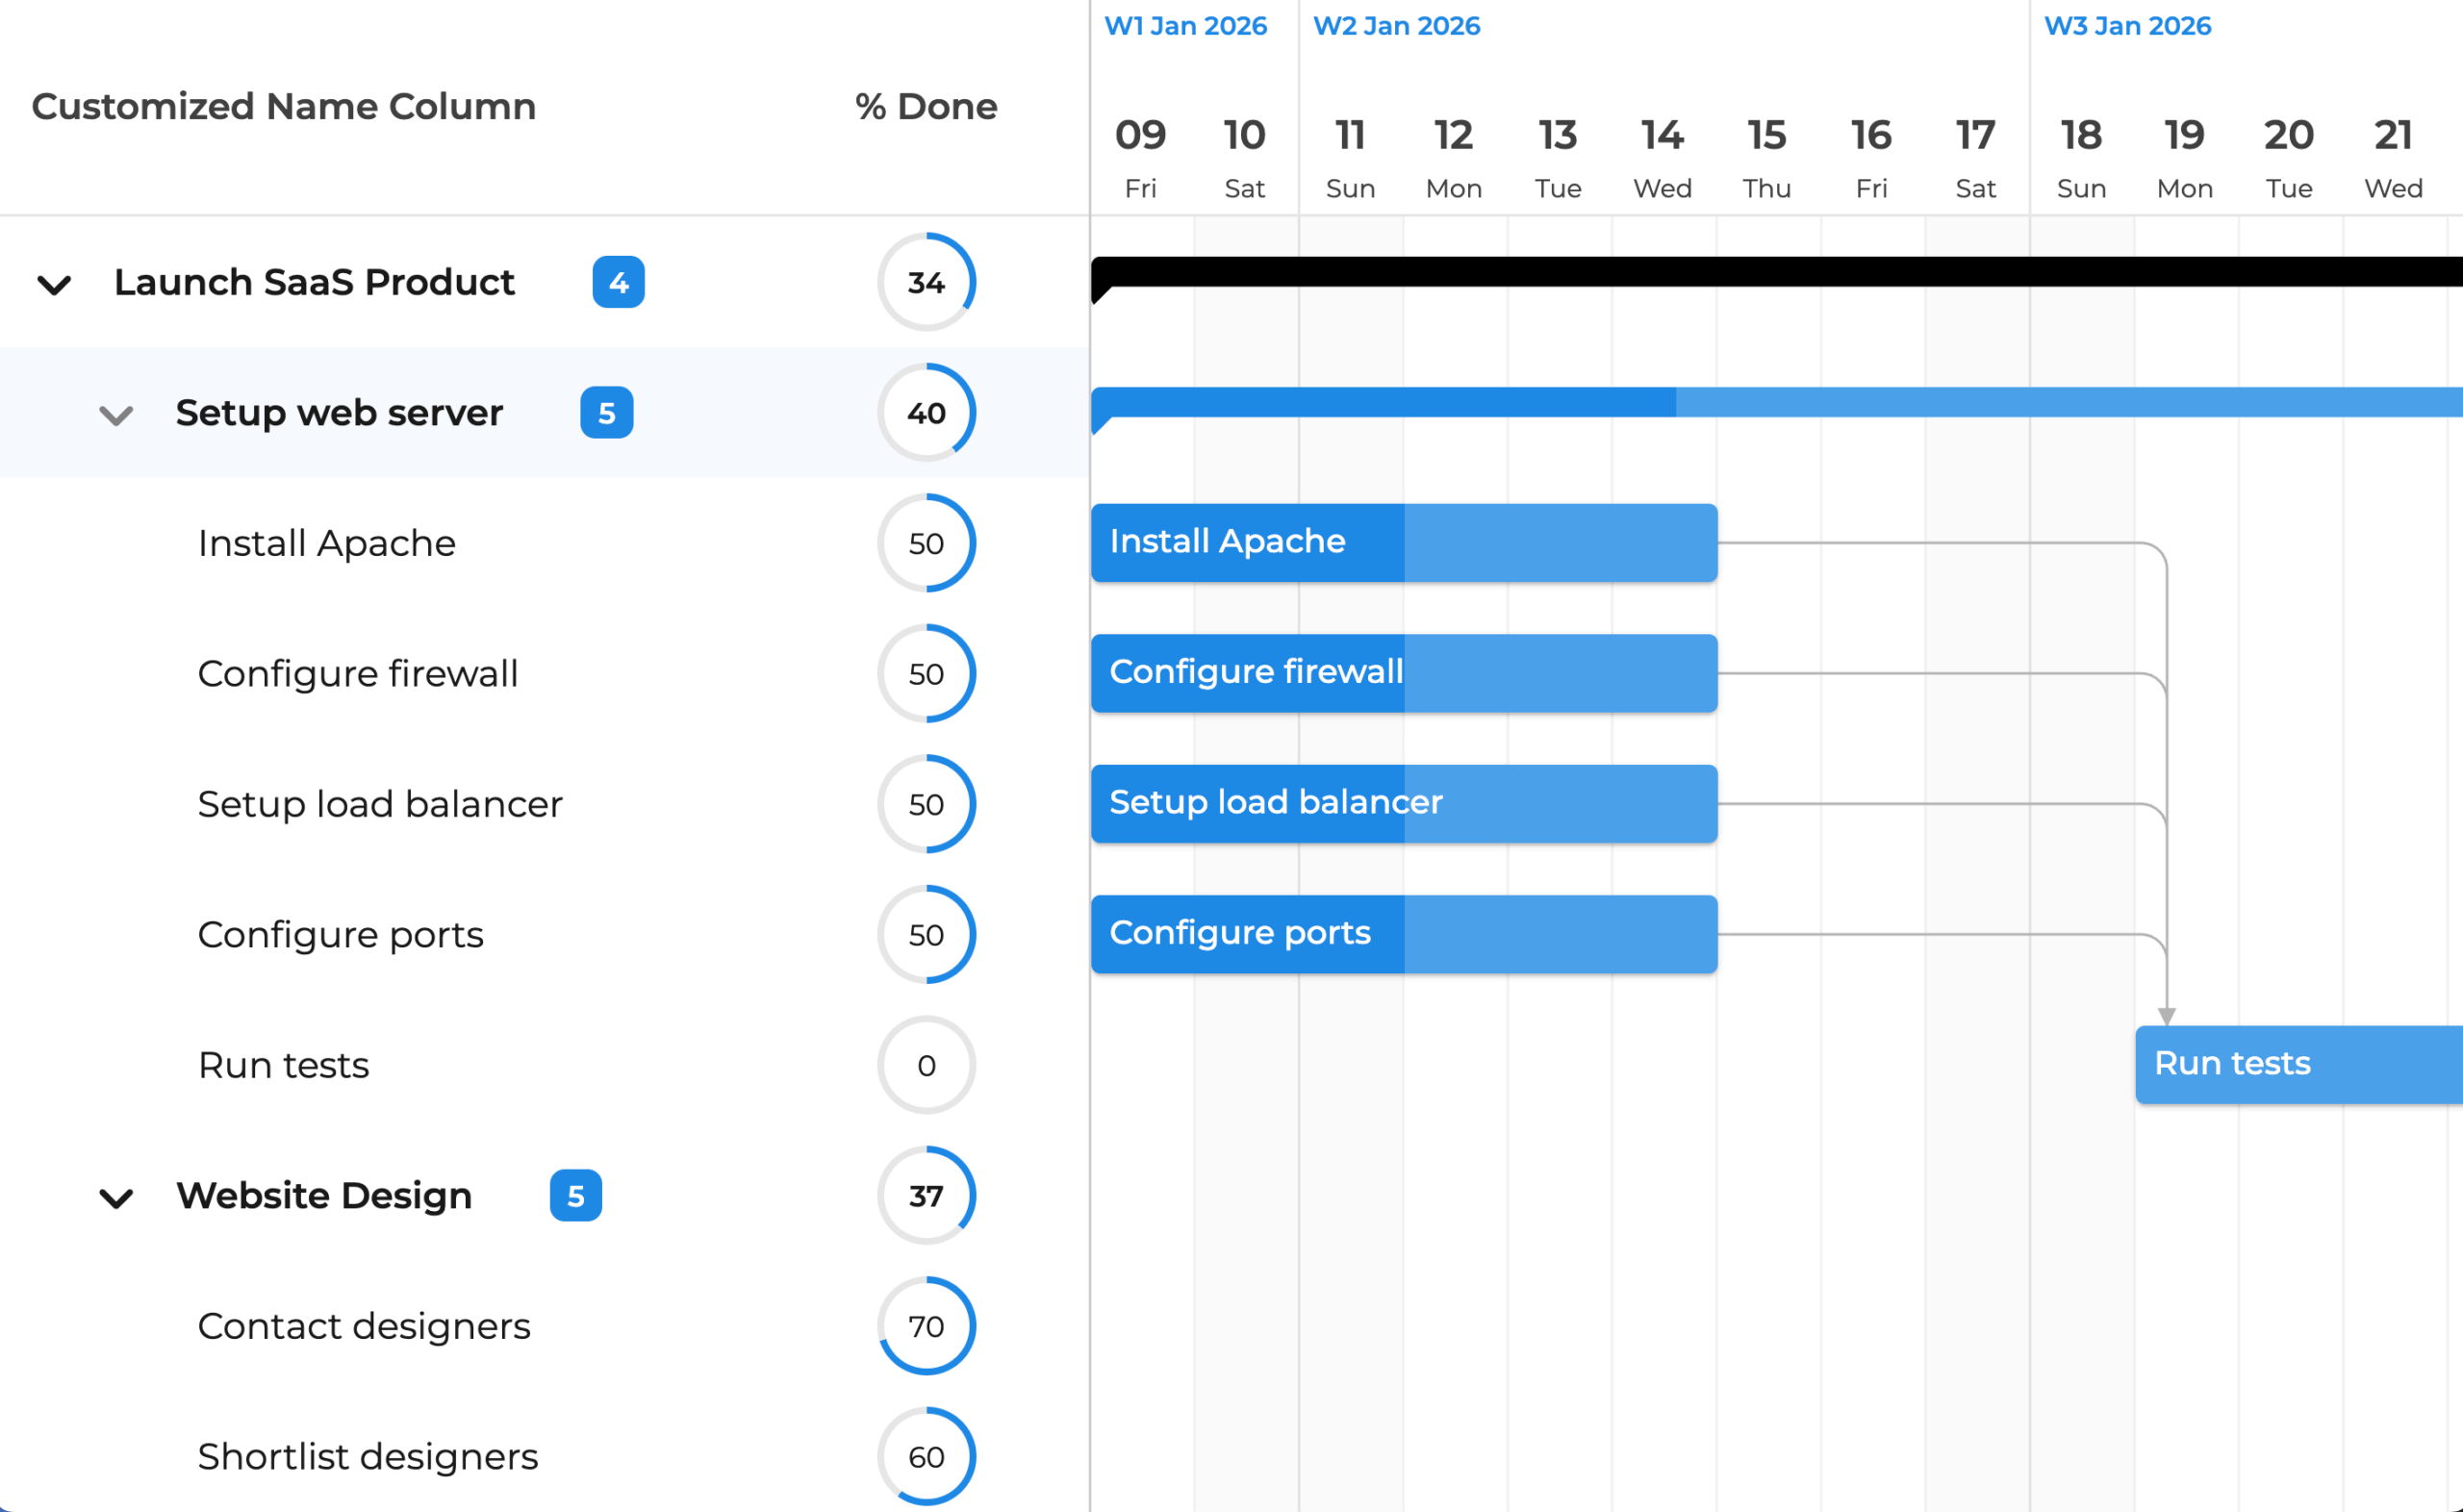
Tailor the JavaScript Gantt chart to match your project’s look, feel, and workflow needs:
- Choose between five themes, or create your own.
- Customize taskbar styles, content, and labels.
- Add your own rich custom tooltips.
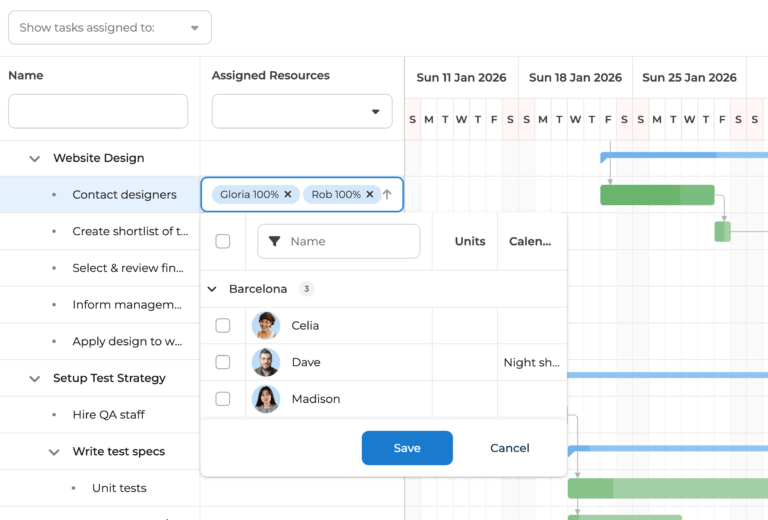
- Use a custom assignment picker for quick task delegation.
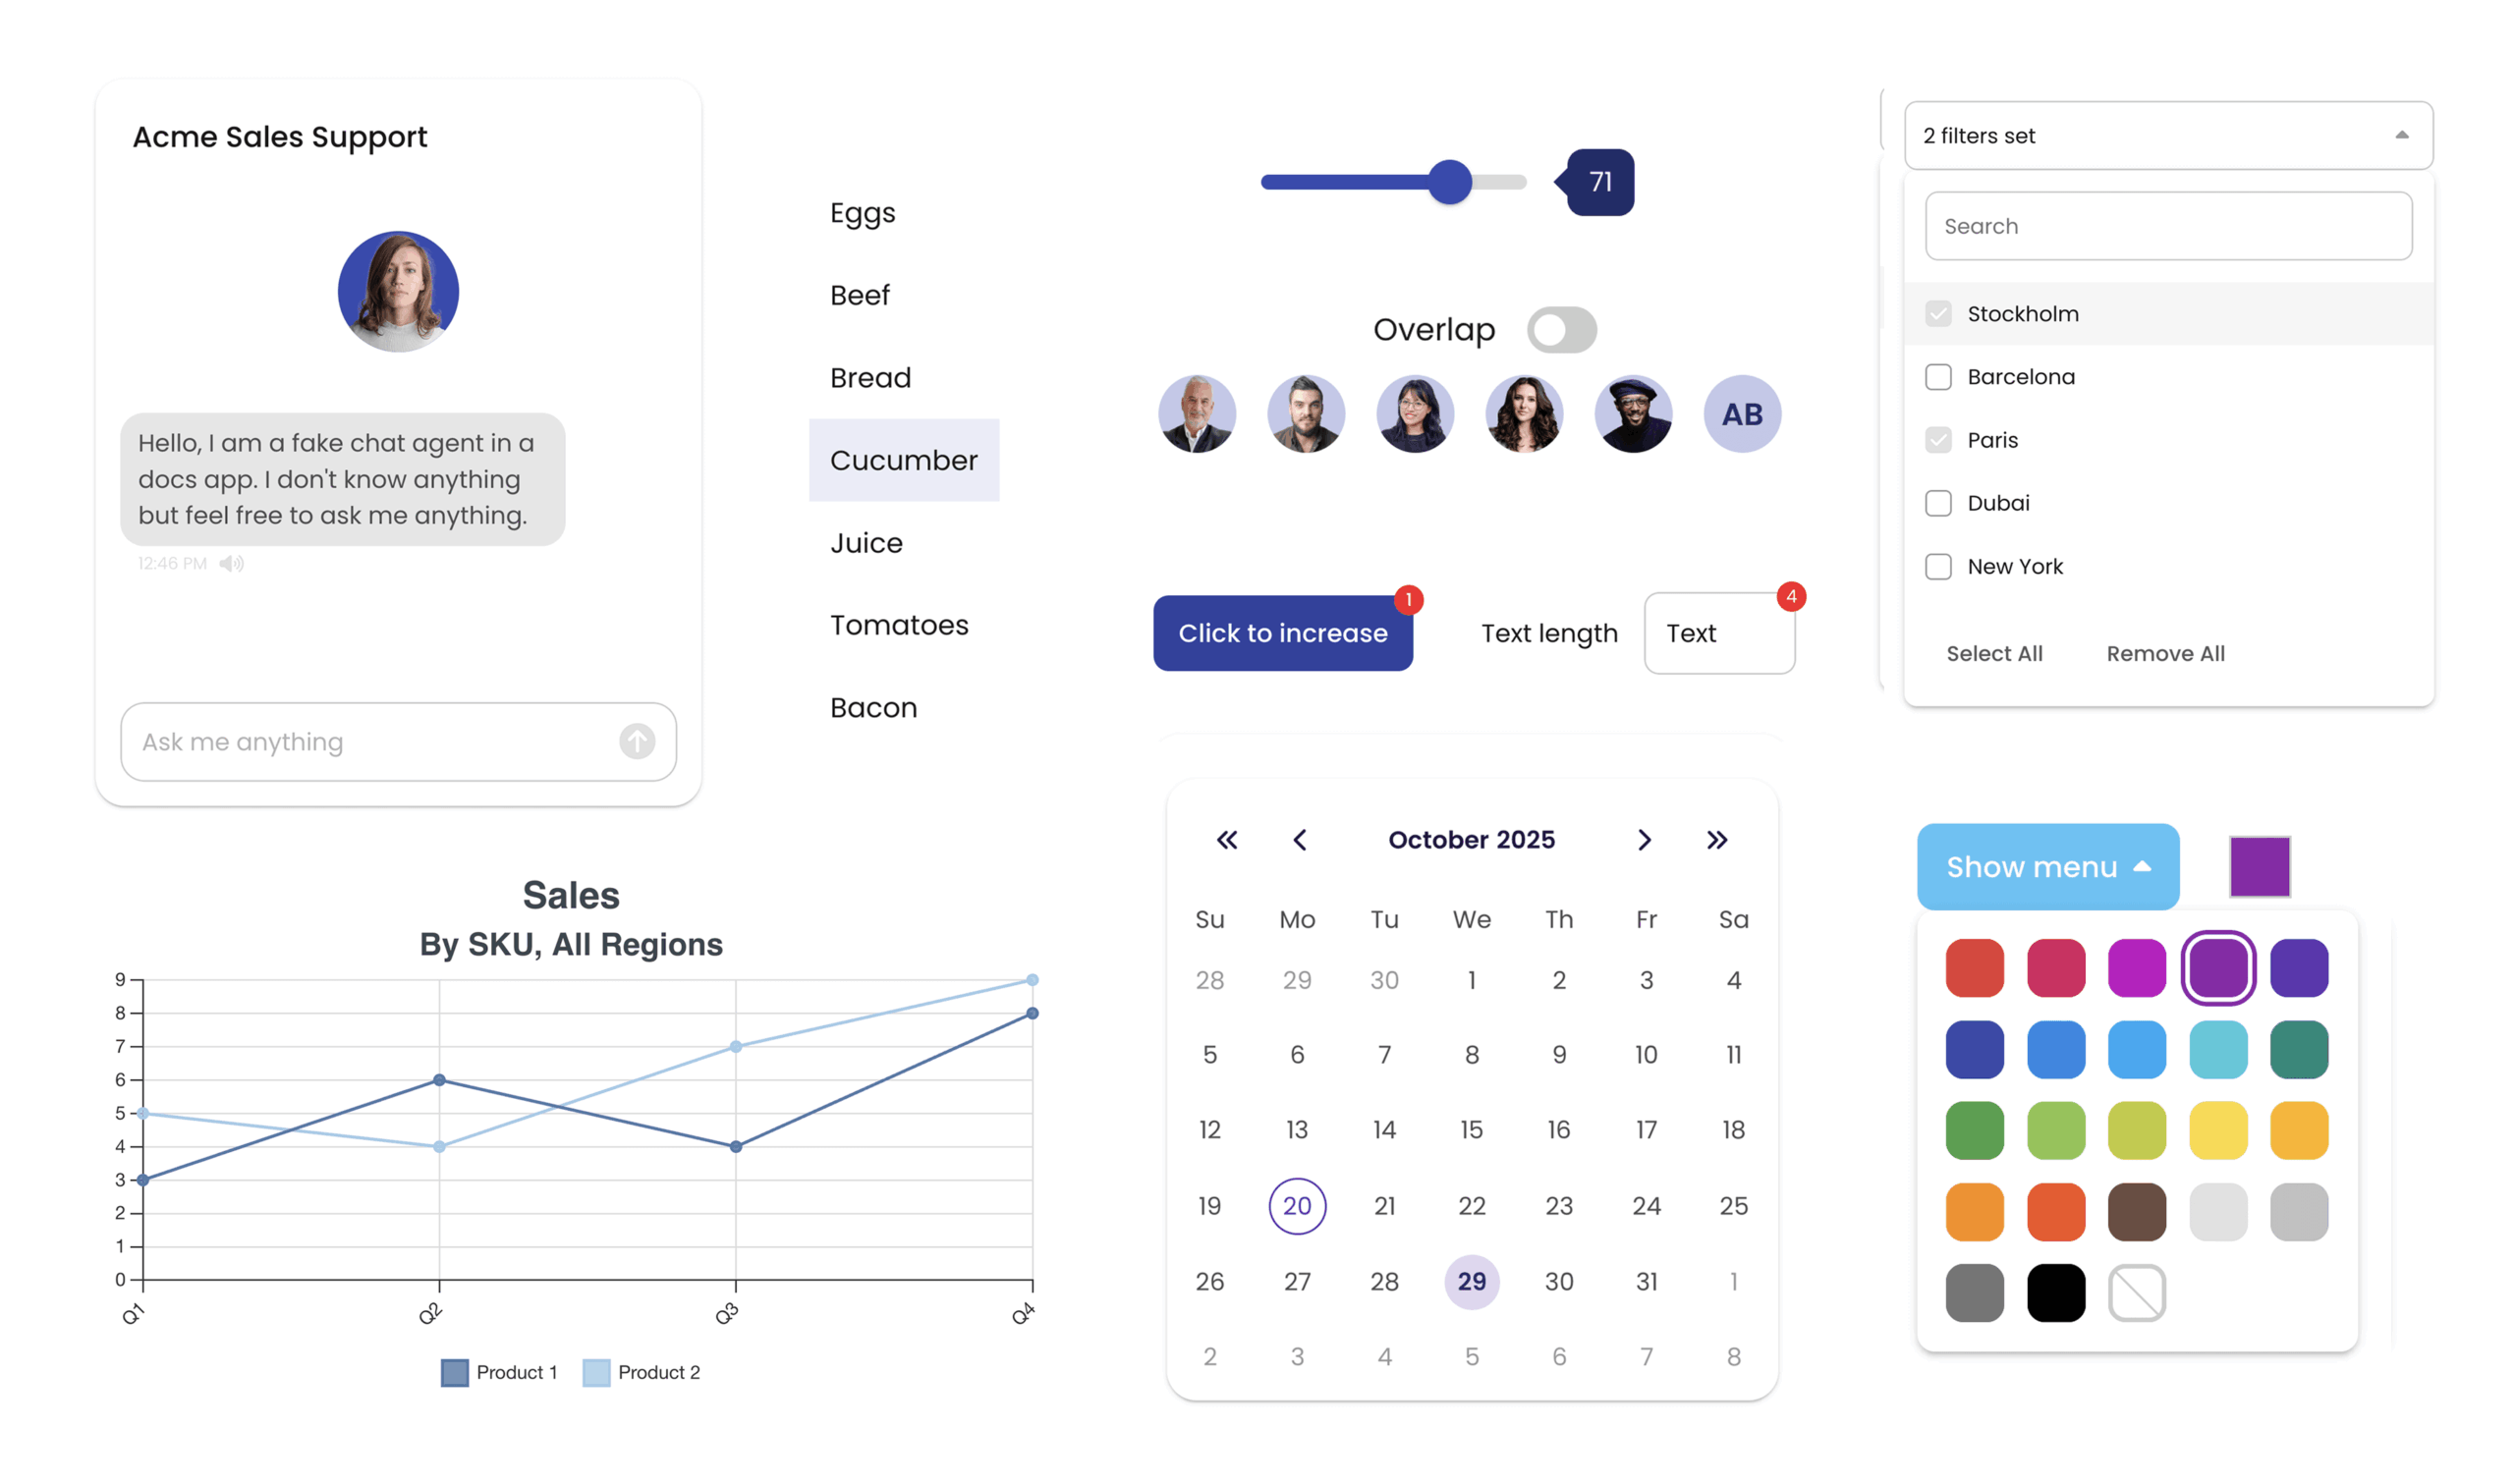
50+ More Widgets
Choose from a wide range of UI elements that easily make your app polished and professional:
- Add chat boxes, menus, toggles, sliders, and more to your Bryntum Gantt chart.
- Meet user needs with fewer clicks and less searching.
- Implement widgets easily with our clear documentation.
By developers, for developers
The World’s Most Flexible JS Gantt Chart
A Gantt chart encapsulates an enormous amount of complexity. We provide you with a simple, yet highly configurable and well-tested API, so you don’t have to worry about the small details.
Best-in-Class Scheduling Engine
The JavaScript Gantt engine efficiently handles asynchronous scheduling for any number of tasks, while factoring in dependencies, constraints, and scheduling modes.
Built independently of the DOM, it can also run server-side on Node.js.
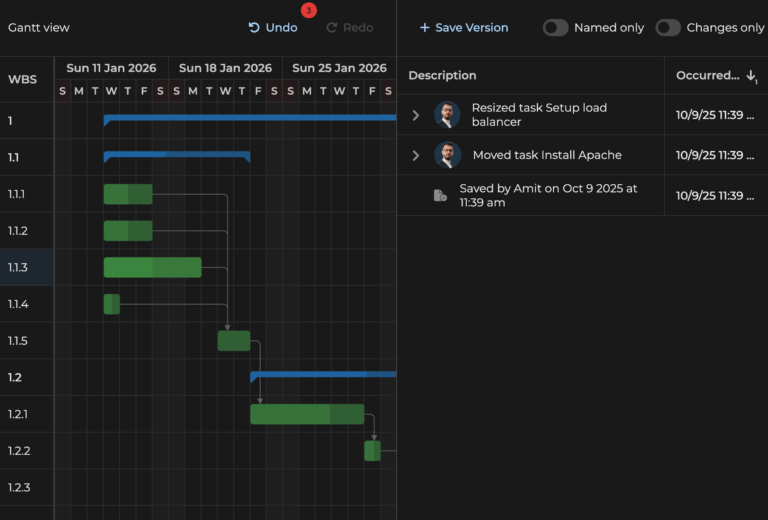
Animated Redraws
Moving a task triggers a smooth animation that shows how dependent tasks are affected by the change.
Customizable Task Editor and Menu
The built-in task editor is made to be easily extended and customized in the JS Gantt chart. You can tailor it to fit your workflow perfectly:
- Change the visible fields
- Add your own custom tabs
- Adapt or replace the right-click task menu.
- Customize the resource picker.
Integrations and Exports
The JavaScript Gantt chart seamlessly integrates with other tools and offers versatile export options to keep your team and stakeholders informed.
- Integrate a PERT chart.
- Export Gantt chart data to Microsoft Excel or a Microsoft Project, print it, or share it in PDF, PNG, and ICS formats.
- Combine Gantt with other Bryntum components, including Scheduler Pro and Task Board.
Install with npm
Try Bryntum Gantt directly from npm. No login or authorization required. Just install the trial, configure, and start building.
Trusted by the world’s leading companies
Try it yourself!
More Examples
Latest Releases
Documentation Browser